The unemployment rate is one of the most closely watched economic indicators in the world. Every month, investors, policymakers, and workers anxiously await the latest figure from the Bureau of Labor Statistics. But how is unemployment rate calculated, and what does that percentage actually tell us about the economy?
In this guide, I will break down exactly how the government measures unemployment, who gets counted, who gets left out, and why the headline number does not always tell the complete story. Whether you are an investor tracking economic signals, a student learning about labor markets, or simply curious about how those monthly jobs numbers are produced, this explanation will give you the clarity you need.
Table of Contents
Key Takeaways
The unemployment rate measures the percentage of the labor force that is jobless and actively seeking work. The Bureau of Labor Statistics calculates it by dividing the number of unemployed people by the total labor force and multiplying by 100. To be counted as unemployed, you must meet three criteria: have no job, be actively seeking work within the past four weeks, and be available to start work. The official rate (U-3) does not include discouraged workers, marginally attached workers, or people working part-time for economic reasons. A broader measure called U-6 includes these groups and typically runs 3-7 percentage points higher than the headline rate.
How Unemployment Rate Is Calculated: The Basic Formula
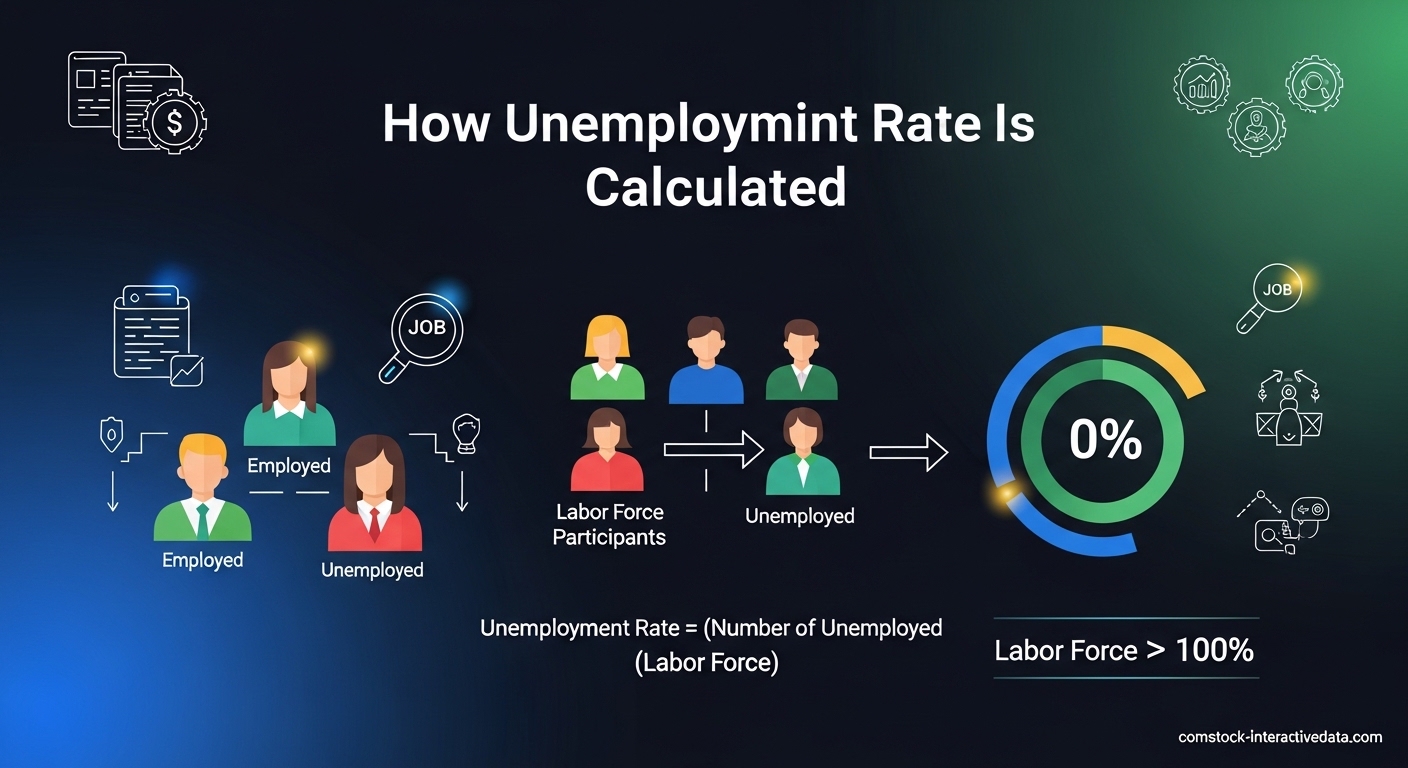
The unemployment rate formula is straightforward on paper: divide the number of unemployed people by the total labor force, then multiply by 100. The result gives you the percentage of the labor force that is currently without work but actively seeking employment.
Unemployment Rate = (Number of Unemployed / Total Labor Force) x 100
Let me walk through a concrete example to make this tangible. Imagine a small town with exactly 100,000 working-age adults who meet the basic criteria for being counted in the statistics. In this example, 60,000 people are currently employed in various jobs. Another 4,000 people are actively seeking work but have not found jobs yet. The remaining 36,000 people are not working and not looking for work—they might be retired, full-time students, stay-at-home parents, or discouraged workers who have given up their job search.
The labor force consists of only the employed and unemployed: 60,000 + 4,000 = 64,000 people. The 36,000 people not seeking work are not counted in the labor force at all. To calculate the unemployment rate, we divide the unemployed (4,000) by the labor force (64,000): 4,000 / 64,000 = 0.0625. Multiply by 100 and you get 6.25 percent unemployment.
That 36,000 figure represents what economists call “not in the labor force.” This distinction is crucial because it means the unemployment rate can actually drop for troubling reasons—if unemployed people stop looking for work, they move from the unemployed category to “not in the labor force,” and the unemployment rate falls even though no one got a job.
Who Counts as Unemployed? The Three Requirements
To be officially counted as unemployed, you must meet all three of these specific criteria established by the Bureau of Labor Statistics. The BLS does not simply count everyone without a job. Their definition is precise, and understanding these requirements explains why the unemployment rate often seems lower than what you might expect based on personal observation.
Requirement 1: You Must Not Have a Job
This seems obvious, but the definition is broader than you might think. The BLS counts you as employed if you performed any work at all for pay or profit during the survey reference week. This includes part-time work, temporary work, gig economy jobs, and even unpaid family work if you worked 15 hours or more. If you did any paid work during that week, you are employed—not unemployed—regardless of how few hours you worked.
Requirement 2: You Must Be Actively Seeking Work
This is where many people get excluded. To count as unemployed, you must have taken specific steps to find work during the four weeks prior to the survey. The BLS defines “actively seeking work” as concrete job search activities: contacting employers directly, submitting resumes or applications, checking with employment agencies, placing or answering job advertisements, or engaging in other active methods.
Simply browsing job postings online without applying does not count. Neither does telling friends you are looking for work or thinking about finding a job. You need documented search activity. The four-week reference period matters because it standardizes the measurement across all respondents and prevents people who gave up months ago from inflating the unemployment count.
Requirement 3: You Must Be Available for Work
Even if you are actively seeking employment, you must also be currently available to accept a job if one were offered. This criterion primarily excludes people who have job offers starting soon but have not begun yet—they are counted as employed. It also excludes people who cannot work due to illness, family obligations, or other temporary circumstances that prevent them from taking a job immediately.
If you fail any of these three requirements, you are not counted as unemployed. Most commonly, people fail the “actively seeking work” test. Those individuals fall into the “not in the labor force” category—a large and often overlooked group that includes millions of working-age adults.
Who Is Counted as Employed?
The BLS counts someone as employed if they did any work at all for pay or profit during the survey reference week. This includes part-time work, temporary jobs, gig economy platforms like Uber or DoorDash, and self-employment. The threshold is remarkably low: even one hour of paid work during the reference week qualifies you as employed.
There is one notable exception to the paid work rule. The BLS counts unpaid family workers as employed if they worked 15 hours or more in a family business or farm during the reference week. This captures family members who contribute to agricultural or small business operations even when they do not receive direct wages.
People who have jobs but were temporarily absent during the reference week—due to vacation, illness, bad weather, parental leave, or other reasons—are still counted as employed. The key is that they have a job to return to, even if they did not work during that specific week.
This definition means that millions of people working part-time jobs they do not want, or gig workers scraping together minimal income, are counted the same as full-time employees with stable careers. Both are simply “employed” in the official statistics.
Understanding the Labor Force: Who Is In and Who Is Out
The labor force is the denominator in the unemployment rate calculation. It includes only two groups: employed people plus unemployed people. If you are neither employed nor unemployed by the BLS definitions, you are “not in the labor force.” This is not a small group—it typically includes about 37 percent of the civilian noninstitutional population.
The civilian noninstitutional population serves as the starting point for all employment statistics. This group includes all people age 16 and older who are not on active duty in the military and not residing in institutions like prisons, nursing homes, or mental health facilities. From this population, the BLS categorizes everyone as either in the labor force or not in the labor force.
Who Is Not in the Labor Force?
People not in the labor force include retirees, students not working or seeking work, stay-at-home parents, people unable to work due to disability, and anyone else who is neither employed nor actively seeking employment. This category also includes what the BLS calls “discouraged workers”—people who want a job and are available for work but have stopped looking because they believe no jobs are available for them.
Discouraged workers are a subset of a larger group called “marginally attached to the labor force.” Marginally attached workers are people who want a job, are available for work, and have looked for a job sometime in the past year, but have not searched in the past four weeks. The difference between discouraged workers and other marginally attached workers is the reason they stopped looking. Discouraged workers cite job-market conditions as their reason for giving up, while other marginally attached workers stopped for reasons like family responsibilities, illness, or returning to school.
None of these groups count in the official unemployment rate. This is why economists and policymakers increasingly look at the labor force participation rate—the percentage of the civilian noninstitutional population that is either working or actively seeking work. When participation falls, it can signal that people are giving up on finding jobs, which makes the unemployment rate look better than the labor market actually is.
How the Government Collects Unemployment Data?
The unemployment rate does not come from counting unemployment insurance claims or scanning job boards. The Bureau of Labor Statistics calculates the rate using data from the Current Population Survey, a massive monthly survey conducted by the U.S. Census Bureau on behalf of the BLS. This survey reaches approximately 60,000 households every month, representing about 110,000 individuals.
The CPS is a scientifically designed sample survey, meaning the Census Bureau carefully selects households to represent the entire U.S. population. The survey has been conducted monthly since 1940, making it one of the most consistent economic data series available. The sample rotates—households are surveyed for four consecutive months, then removed for eight months, then surveyed again for four more months. This rotation prevents respondent fatigue while maintaining continuity.
Survey data collection occurs during the week containing the 19th day of each month. The questions focus on employment status during the reference week, which is the week containing the 12th day of the month. Census Bureau interviewers contact households by phone, online, or in-person to collect responses. The response rate is typically around 88 percent, which is high for a voluntary survey.
Once the Census Bureau collects the data, they weight the responses to match population totals and demographic distributions. The BLS then analyzes the weighted data to estimate the number of employed, unemployed, and not-in-labor-force individuals for the entire civilian noninstitutional population. These estimates become the basis for the monthly unemployment rate and related statistics.
One important detail: the BLS publishes both seasonally adjusted and not seasonally adjusted unemployment rates. Seasonal adjustment removes predictable patterns that occur at the same time every year—like retail hiring before the holidays or construction layoffs in winter. The seasonally adjusted rate is the headline number you see in news reports because it better reflects underlying economic trends rather than predictable seasonal patterns.
The Four Types of Unemployment
Economists categorize unemployment into four distinct types, each with different causes and policy implications. Understanding these categories helps explain why some unemployment is inevitable and healthy, while other types signal economic problems requiring intervention.
Frictional Unemployment
Frictional unemployment occurs when workers are temporarily between jobs. This includes people who voluntarily left one position to seek a better one, new graduates entering the labor market, and workers relocating to new cities. Some level of frictional unemployment is always present and actually indicates a dynamic, growing economy where workers feel confident enough to seek better opportunities. This type of unemployment is generally short-term and represents the normal churn of a functioning labor market.
Cyclical Unemployment
Cyclical unemployment rises and falls with the business cycle. During economic expansions, cyclical unemployment falls as businesses hire more workers. During recessions, it rises as companies lay off employees to cut costs. This is the type of unemployment policymakers most want to reduce because it represents wasted productive capacity and unnecessary economic hardship. The Federal Reserve targets cyclical unemployment when setting interest rates, aiming to keep the economy near “full employment” without overheating.
Structural Unemployment
Structural unemployment results from a mismatch between workers’ skills and available jobs. This can happen when technological change makes certain skills obsolete, when industries relocate to other regions or countries, or when fundamental shifts in consumer demand eliminate entire job categories. Unlike cyclical unemployment, structural unemployment does not resolve when the economy improves. Workers need retraining, relocation, or new industries to emerge before they can find jobs. Structural unemployment can persist for years and often requires targeted policy interventions like education programs or economic development initiatives.
Institutional Unemployment
Institutional unemployment stems from government policies, labor market institutions, or incentive structures that affect unemployment. Examples include high minimum wages that price some workers out of jobs, generous unemployment benefits that extend job search periods, or strict employment protection laws that make businesses reluctant to hire. Economists debate how significant institutional factors are in practice, but most agree that policy choices can influence the natural level of unemployment in an economy.
U-3 vs U-6: Understanding Alternative Unemployment Measures
The headline unemployment rate you see on the news is officially called U-3. The BLS actually publishes six different unemployment rates (U-1 through U-6), each with a progressively broader definition of who counts as unemployed. Understanding U-3 versus U-6 is particularly important because these two measures often tell very different stories about labor market health.
U-3, the official unemployment rate, includes only people who are jobless, actively seeking work in the past four weeks, and available for work. It excludes discouraged workers, marginally attached workers, and people working part-time who want full-time work.
U-6, the broadest measure, starts with U-3 and adds three additional groups: marginally attached workers who want jobs and have looked in the past year but not the past four weeks, discouraged workers (a subset of marginally attached), and people employed part-time for economic reasons who want full-time work but cannot find it. U-6 provides a much more comprehensive picture of labor market slack.
| Measure | Includes | Excludes | Typical Range |
|---|---|---|---|
| U-3 (Official) | Jobless, actively seeking work within 4 weeks, available for work | Discouraged workers, marginally attached, part-time for economic reasons | 3% – 10% |
| U-6 (Broad) | U-3 plus marginally attached, discouraged workers, and part-time workers who want full-time jobs | People not wanting work at all | 7% – 18% |
Historically, U-6 typically runs about 3 to 7 percentage points higher than U-3. For example, if U-3 is 4.0 percent, U-6 might be around 7.5 to 8.5 percent. This gap widens during recessions when more people become discouraged or settle for part-time work, and narrows during strong expansions when jobs are plentiful.
Many economists argue that U-6 gives a truer picture of labor market conditions, especially after economic downturns. When you hear someone claim the “real” unemployment rate is much higher than the official figure, they are usually referring to U-6 or a similar broader measure. Both numbers are valid—the key is understanding what each measures and why the gap between them matters.
Unemployment Insurance Claims vs Unemployment Rate: What’s the Difference?
A common source of confusion is the difference between weekly unemployment insurance claims and the monthly unemployment rate. News outlets report both figures, but they measure completely different things using different data sources. Understanding this distinction clears up much of the confusion about employment statistics.
Weekly UI claims represent the number of people who have filed new applications for unemployment insurance benefits. These are administrative counts from state unemployment offices, not survey estimates. The weekly claims number gives a near-real-time pulse on layoffs and job separations because it captures people actually applying for benefits.
However, UI claims have significant limitations. Not all unemployed workers qualify for unemployment insurance. Gig workers, contractors, the self-employed, recent hires, and people who quit their jobs voluntarily typically cannot receive UI benefits. Additionally, some eligible workers never apply for benefits. The UI claims data captures only a subset of people losing jobs.
The monthly unemployment rate from the CPS survey counts a completely different group. It includes all people who meet the criteria regardless of UI eligibility. It captures unemployment even among workers who never qualified for or applied for benefits. It also captures people who lost jobs weeks or months ago and are still seeking work.
This is why the two numbers often move in different directions. UI claims might fall because fewer people are getting laid off, or because benefits have expired for long-term unemployed workers. The unemployment rate might rise even as UI claims fall if people who were not previously seeking work start looking for jobs again. Both metrics provide useful information, but they are not interchangeable.
Limitations of the Official Unemployment Rate
The official unemployment rate is a useful economic indicator, but it has well-documented limitations that anyone interpreting the data should understand. These limitations do not make the statistic worthless, but they explain why economists look at multiple measures when assessing labor market health.
Underemployment Is Not Captured
The official rate counts a part-time worker seeking full-time employment the same as a worker with a full-time career position. Both are simply “employed.” This means the unemployment rate can improve even when workers are taking inferior jobs out of desperation. The U-6 measure partially addresses this by including part-time workers who want full-time hours, but even U-6 does not capture workers who took lower-paying jobs beneath their skill level.
Discouraged Workers Disappear from the Count
When unemployed workers stop actively seeking jobs, they are no longer counted as unemployed. They move to “not in the labor force,” and the unemployment rate falls. This creates a perverse situation where the unemployment rate can drop because the job market is so bad that people give up looking. During prolonged economic weakness, this phenomenon can make the official rate look significantly better than reality.
Sampling Error and Monthly Volatility
The CPS is a sample survey, not a census of the entire population. This means the unemployment rate has a margin of error. The BLS reports that a monthly change in unemployment of about 0.2 percentage points may not be statistically significant. Small month-to-month moves should be interpreted cautiously. Economists generally look at three-month averages or year-over-year changes to identify real trends rather than statistical noise.
No Information About Job Quality
The unemployment rate tells you nothing about wages, job security, benefits, or career advancement opportunities. An economy with 4 percent unemployment where jobs pay poverty wages looks the same statistically as an economy with 4 percent unemployment where jobs offer middle-class stability. Supplementary data on wages, hours worked, and job quality are essential for a complete labor market picture.
How Unemployment Measurement Has Evolved?
The current methodology for measuring unemployment in the United States was established during the Great Depression. Before the 1930s, the government had no systematic way to track employment. The Works Progress Administration and other New Deal programs needed reliable labor market data, prompting the development of the Current Population Survey.
The CPS began monthly data collection in 1940 and has used substantially the same methodology ever since. The survey has been updated over the decades to account for changing demographics, new modes of data collection, and evolving definitions of employment. However, the core concepts—employed, unemployed, and not in the labor force—have remained remarkably consistent.
The biggest evolution in unemployment statistics came in 1994 when the BLS began publishing the U-6 measure and the other alternative unemployment rates. Before then, only the standard U-3 rate was widely reported. The addition of U-6 responded to criticism that the official rate was too narrow and missed important aspects of labor market distress.
Looking ahead, the BLS continues to adapt its methodology to capture the changing nature of work. The rise of the gig economy, remote work, and portfolio careers presents ongoing measurement challenges. The fundamental framework remains sound, but the details of who counts as employed and how work is defined continue to evolve.
What the Unemployment Rate Really Means?
Context matters enormously when interpreting unemployment rates. A 5 percent unemployment rate might signal a healthy economy in one historical period but indicate trouble in another. The natural rate of unemployment—the level that persists even in a strong economy due to frictional and structural factors—changes over time and varies across countries.
Most economists believe the natural rate of unemployment in the United States currently falls somewhere between 4.0 and 5.0 percent. When unemployment falls below this range, inflationary pressures typically build as employers compete for scarce workers by bidding up wages. When unemployment rises above this range, it indicates cyclical unemployment and wasted economic capacity.
Generally, unemployment rates below 4 percent suggest a very tight labor market where workers have significant bargaining power. Rates between 4 and 6 percent indicate reasonable labor market health with moderate worker bargaining power. Rates above 6 percent typically signal economic weakness, and rates above 8 percent indicate serious labor market distress requiring policy intervention.
However, these rules of thumb must be combined with other indicators. The labor force participation rate, wage growth data, job openings statistics, and broader measures like U-6 all provide context. A 4 percent unemployment rate with falling participation and stagnant wages tells a very different story than a 4 percent rate with rising participation and strong wage growth.
Frequently Asked Questions
How is the unemployment rate actually calculated?
The unemployment rate is calculated by dividing the number of unemployed people by the total labor force and multiplying by 100. To be counted as unemployed, a person must be jobless, have actively sought work within the past four weeks, and be available to start work. The Bureau of Labor Statistics collects this data through the Current Population Survey, which reaches approximately 60,000 households monthly.
Is 4.5% a good unemployment rate?
Yes, 4.5 percent is generally considered a healthy unemployment rate. Most economists estimate the natural rate of unemployment in the United States falls between 4.0 and 5.0 percent. At 4.5 percent, the economy is typically near full employment with moderate worker bargaining power without excessive inflationary pressure.
What does a 5% unemployment rate mean?
A 5 percent unemployment rate means that 5 out of every 100 people in the labor force are actively seeking work but do not currently have jobs. In practical terms, this generally indicates a functioning labor market with reasonable opportunities for job seekers. It suggests the economy is operating near its natural capacity with mostly frictional and structural unemployment rather than widespread cyclical joblessness.
What does it mean if the unemployment rate is 8%?
An 8 percent unemployment rate indicates significant labor market distress. This level suggests substantial cyclical unemployment beyond the natural rate, typically associated with recession or serious economic weakness. At 8 percent, job seekers face considerable difficulty finding employment, workers have reduced bargaining power, and policymakers usually consider intervention to stimulate job growth.
Who is not counted in the unemployment rate?
The unemployment rate does not count several groups: discouraged workers who have stopped looking for jobs, marginally attached workers who have not searched in the past four weeks, people working part-time who want full-time work, retirees, full-time students not seeking work, stay-at-home parents, and anyone not actively seeking employment within the past four weeks.
What is the difference between U-3 and U-6 unemployment?
U-3 is the official unemployment rate counting only people who are jobless and actively seeking work within the past four weeks. U-6 is a broader measure that includes U-3 plus marginally attached workers, discouraged workers, and people working part-time for economic reasons who want full-time jobs. U-6 typically runs 3-7 percentage points higher than U-3 and provides a more comprehensive view of labor market slack.
Are unemployment insurance claims the same as the unemployment rate?
No, these are different measures using different data sources. Weekly unemployment insurance claims count people filing for UI benefits and reflect administrative data from state offices. The monthly unemployment rate comes from a survey of households and counts anyone meeting the criteria regardless of UI eligibility. Many unemployed people do not qualify for or apply for UI benefits, so the two numbers often differ significantly.
Why are discouraged workers not counted as unemployed?
Discouraged workers are not counted as unemployed because they fail the actively seeking work requirement. To be officially unemployed, a person must have taken specific job search steps within the past four weeks. Discouraged workers have given up looking because they believe no jobs are available for them, so they are classified as not in the labor force rather than unemployed.
Conclusion
The unemployment rate is a simple percentage built on complex definitions. The Bureau of Labor Statistics calculates it by dividing the unemployed by the labor force, but who counts in each category follows strict rules that exclude millions of jobless adults. Understanding the unemployment rate requires knowing who is in the labor force, who is actively seeking work, and who has been left out entirely.
The headline U-3 unemployment rate serves as a useful economic indicator, but it is not the complete picture. Smart observers also watch U-6 for a broader view, monitor the labor force participation rate for hidden weakness, and track wage data for insights into job quality. The unemployment rate is one tool among many for assessing economic health.
When you see the next jobs report headline, you will know what that number actually represents. You will understand why it might seem lower than your personal experience suggests, why it can drop for troubling reasons, and why alternative measures like U-6 exist. The unemployment rate is a powerful economic signal—now you know how to read it accurately.