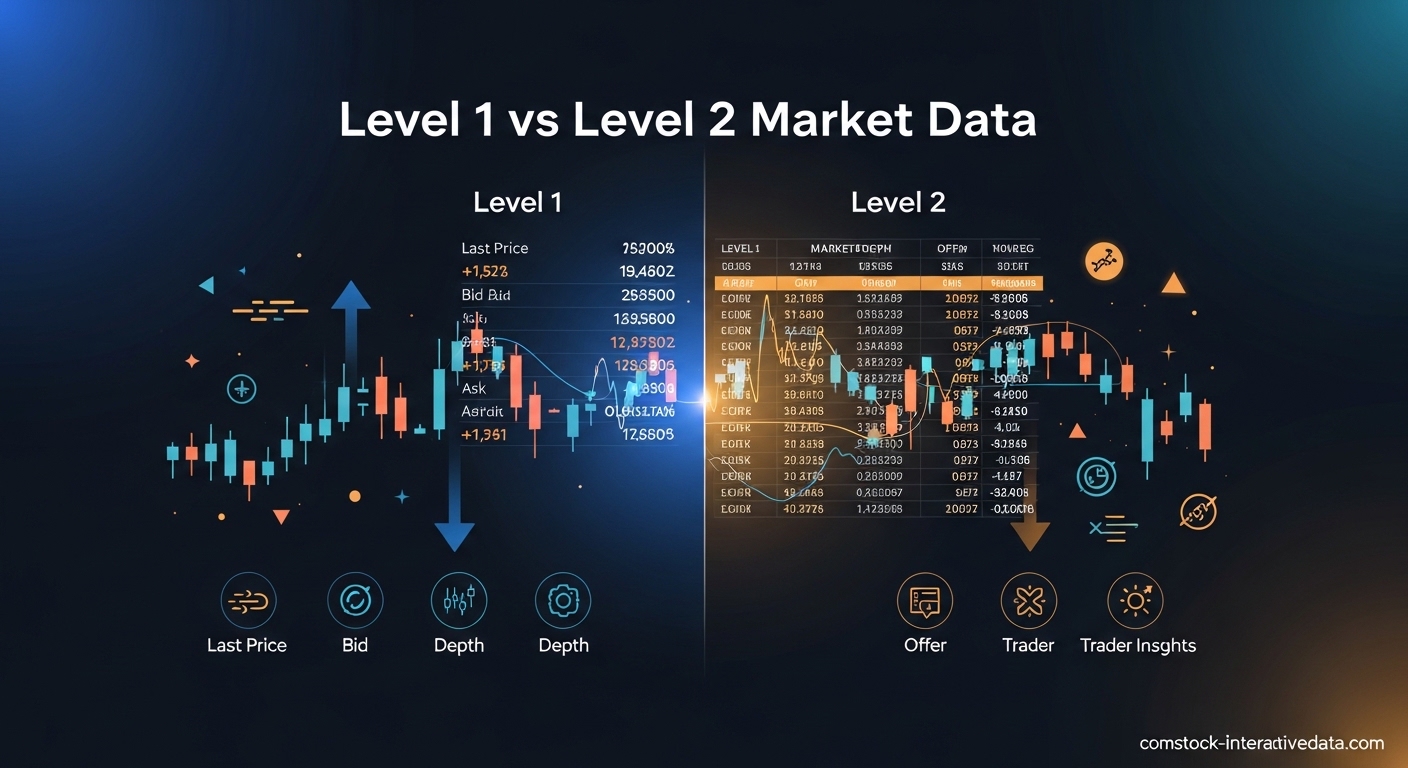
Level 1 market data shows you the best bid and ask prices with basic trading information, while Level 2 market data reveals the complete order book depth including all outstanding orders at multiple price levels and market maker identities. The key difference comes down to information depth. Level 1 gives you the surface view, and Level 2 shows you what is happening beneath the surface.
If you are trying to decide which data feed suits your trading style, this guide breaks down everything you need to know. I have spent years working with both data types across different trading platforms. Our team has analyzed how retail traders actually use these feeds in real market conditions.
By the end of this article, you will understand exactly what each data level offers, who benefits from Level 2’s additional detail, and whether the extra cost justifies the investment for your specific trading approach.
Table of Contents
What is Level 1 Market Data?
Level 1 market data, often called top-of-book data, provides the essential real-time pricing information that most investors and casual traders need. This data feed displays the National Best Bid and Offer (NBBO), which represents the highest bid price and lowest ask price available across all exchanges. You also get the last traded price, current trading volume, and basic bid and ask sizes.
Think of Level 1 as looking at the surface of a lake. You can see what is happening right at the top, but nothing below the waterline is visible.
Level 1 Data Components
The core components of Level 1 market data include several key data points that update in real-time during market hours. The NBBO shows the best available prices, giving you the tightest possible spread for your trades. The last traded price tells you where the most recent transaction occurred.
Bid size and ask size indicate how many shares are available at the best prices. This helps you gauge whether large orders might move the price significantly. Trading volume shows the total shares exchanged so far during the session.
Who Uses Level 1 Data
Level 1 data serves long-term investors, swing traders, and beginners perfectly well. If you hold positions for days, weeks, or months, the micro-movements shown in Level 2 add noise without meaningful value. Position traders care more about daily closes and trend direction than moment-to-moment order flow.
Many retail brokers provide Level 1 data at no additional cost. This makes it accessible to anyone starting their trading journey without committing to expensive data subscriptions.
Limitations of Level 1
The main limitation of Level 1 data is its narrow scope. You only see the best prices, not the full picture of supply and demand waiting at other price levels. This becomes problematic when trading thinly traded stocks or during volatile periods.
Without seeing the order book depth, you cannot identify significant support and resistance levels forming at prices away from the current quote. You also miss the activity of market makers and institutional participants working orders at various levels.
What is Level 2 Market Data?
Level 2 market data provides a detailed view of the order book showing multiple price levels beyond just the best bid and ask. This data feed reveals market depth by displaying outstanding orders at various prices along with the size of each order. You can see which market makers, electronic communication networks (ECNs), and other participants are posting liquidity at each level.
Traders often call this the DOM or Depth of Market display. It transforms trading from guessing based on surface prices into reading the actual supply and demand dynamics driving price movements.
Level 2 Data Components
Level 2 displays a price ladder showing bids on the left side and asks on the right side. Each price level lists the available size and often identifies the market participant posting those shares. The time and sales feed, sometimes called the tape, runs alongside showing executed transactions in real-time.
The order book shows you exactly how much liquidity exists at each price level. Large blocks of shares sitting at specific prices often act as magnets or barriers for price movement. You can watch orders being added, removed, or executed as the action unfolds.
How to Read Level 2 Data
Reading Level 2 starts with understanding the price ladder layout. The highest bid prices appear at the top of the left column, with progressively lower bids below. The lowest ask prices sit at the top of the right column, with higher asks listed underneath.
The gap between the best bid and best ask represents the spread. Tight spreads indicate liquid markets with plenty of participants. Wide spreads suggest thin liquidity where your orders might move the price significantly.
Watch for size imbalances between the bid and ask sides. When one side shows substantially more shares available, that often indicates directional pressure. Large orders getting eaten through quickly suggest aggressive buying or selling interest.
Market Participants Visible in Level 2
Level 2 identifies the various liquidity providers operating in the market. Market makers post continuous two-sided quotes to provide liquidity and earn the spread. ECNs match orders electronically and often display as anonymous or coded identifiers. Wholesalers handle retail order flow from brokerages.
Recognizing participant patterns helps you understand who is driving the action. Some market makers are known for specific behaviors like stepping away during volatility or providing size on certain types of stocks. This knowledge helps you anticipate how price might react to order flow changes.
Level 1 vs Level 2 Market Data: Key Differences
The fundamental difference between these data feeds lies in the depth of information provided. Level 1 offers a snapshot of current market conditions at the surface level. Level 2 delivers the complete picture of supply and demand dynamics throughout the order book.
Quick Comparison
| Feature | Level 1 Market Data | Level 2 Market Data |
|---|---|---|
| Price Levels Shown | Best bid and ask only | Multiple price levels (full depth) |
| Market Depth | Surface view only | Complete order book visibility |
| Participant IDs | None | Market makers and ECNs visible |
| Order Size Detail | Size at best prices only | Size at all price levels |
| Time and Sales | Basic or delayed | Real-time transaction feed |
| Best For | Long-term investors, beginners | Day traders, scalpers, active traders |
| Typical Cost | Free or low cost | $10-100+ per month |
Data Depth and Detail Comparison
Level 1 shows you the NBBO, giving you just enough information to place a market order or a basic limit order at the current price. You know where the market is trading right now, but you cannot see where it might be heading or what obstacles lie ahead.
Level 2 reveals the entire supply and demand curve surrounding the current price. You can identify large resting orders that might act as support or resistance. You see liquidity gaps where price could move quickly once a level gets taken out.
Cost Comparison
Most brokers include Level 1 data in standard trading accounts without additional fees. Some may require a minimum account balance or trading activity to waive data fees. The cost barrier for Level 1 is essentially zero for active traders.
Level 2 data requires a separate subscription ranging from roughly $10 to over $100 monthly depending on the exchange and data package. NASDAQ Level 2 typically costs around $10-25 per month. NYSE ArcaBook and other regional exchanges add additional fees. Professional data terminals with Level 2 access can cost thousands monthly.
Benefits of Level 2 Data and When to Use Each Type
Understanding when Level 2 data provides genuine value helps you make an informed decision about paying for the upgrade. Not every trader needs this level of detail. Some trading styles actually suffer from information overload when presented with too much data.
Benefits of Level 2 Market Data
Level 2 data offers four primary advantages for active traders. First, it provides more accurate supply and demand information by showing the full order book rather than just the surface. You can see where significant buying or selling interest actually exists.
Second, Level 2 reveals liquidity conditions at multiple price levels. This helps you size positions appropriately and avoid slippage on larger trades. You know whether the market can absorb your order without moving against you.
Third, you can identify significant support and resistance areas by spotting large clusters of orders. These levels often predict where price will stall or reverse. Watching how price behaves near these levels provides valuable trading signals.
Fourth, Level 2 shows which market makers are active in a stock. Recognizing participant behavior helps you anticipate their strategies. Some market makers consistently provide liquidity while others step away during volatility.
When to Use Level 1 Data
Level 1 data suits several trader profiles perfectly. Long-term investors holding positions for weeks or months do not need second-by-second order book updates. The noise of Level 2 distracts from the bigger picture analysis that matters for their timeframe.
Beginners should start with Level 1 to master the basics before adding complexity. Learning to read price action and volume comes first. Adding order book analysis too early creates overwhelm without improving results.
Traders working higher timeframes from 15-minute charts up to daily or weekly charts rarely need Level 2. The micro-structure shown in the order book does not significantly impact trades held for hours or days.
When to Use Level 2 Data?
Level 2 becomes essential for specific trading approaches. Day traders making multiple entries and exits within a single session benefit enormously from seeing order flow develop in real-time. The additional information helps time entries and exits with greater precision.
Scalpers attempting to capture small price movements depend on Level 2 for execution timing. A few cents of slippage destroys scalping profits, so knowing exactly where liquidity sits matters enormously. Reading the tape alongside the order book confirms whether momentum supports a quick trade.
Traders working with low-float stocks or thinly traded securities need Level 2 to avoid getting stuck in illiquid positions. These stocks can move dramatically when large orders hit the market. Seeing the book helps you anticipate and avoid these traps.
Trading Applications
Level 2 data enables several specific trading techniques. Support and resistance trading improves because you can see actual order clusters forming at key levels. You watch whether large orders hold firm or get pulled as price approaches.
Order flow trading uses the sequence of transactions and book changes to predict short-term direction. Large market orders hitting the tape indicate urgent buying or selling interest. Watching the book replenish or fail to replenish after trades tells you about underlying conviction.
Breakout trading benefits from seeing whether resistance levels have genuine supply behind them or are just thin air. A level with thousands of shares offered provides a real barrier. A level with minimal size will break easily.
Understanding Level 2 Deception Tactics
The transparency of Level 2 data cuts both ways. While you can see the order book, sophisticated participants can also see you seeing it. This creates opportunities for market manipulation through various deception tactics. Understanding these techniques protects you from making decisions based on false signals.
Spoofing and Layering
Spoofing involves placing large orders with no intention of executing them, then canceling once price moves in the desired direction. A manipulator might post a large sell order above the market to scare other traders into selling. Once price drops, they cancel the fake order and buy at lower prices.
Layering takes spoofing further by placing multiple fake orders at different price levels. This creates the illusion of heavy supply or demand throughout the book. The layered orders get canceled rapidly once the manipulator achieves their price target.
These tactics are illegal under modern market regulations, but they still occur. Regulators have prosecuted several high-profile spoofing cases in 2026, yet the practice persists in subtler forms.
Iceberg Orders
Iceberg orders, also called reserve orders, display only a small portion of the total order size in the Level 2 book. The rest remains hidden until the displayed portion executes. Once the visible chunk fills, another slice appears automatically.
This technique allows large traders to work substantial positions without showing their full hand. You might see 100 shares offered at a level while thousands more wait hidden behind it. Price appears to break through a level easily, then suddenly encounters the hidden size and reverses.
Recognizing iceberg behavior requires watching how the book replenishes after executions. If size reappears immediately at the same level repeatedly, you are likely seeing an iceberg.
How to Avoid Getting Fooled?
Protecting yourself from deception starts with skepticism about what you see. Large orders that appear and disappear rapidly warrant suspicion. Genuine interest typically persists or adjusts gradually rather than vanishing instantly.
Cross-reference Level 2 signals with time and sales data. The tape shows what actually executed versus what was merely posted. If large orders sit in the book but never print on the tape, they may be spoofing.
Avoid trading purely based on Level 2 without considering the broader context. Support and resistance levels from higher timeframes, overall market conditions, and fundamental factors all matter. Level 2 provides execution timing, not standalone trade signals.
What About Level 3 Market Data?
Level 3 market data represents the most detailed feed available, designed primarily for market makers and exchange members. This data level includes everything in Level 2 plus the ability to enter quotes and execute trades directly against the displayed orders.
Level 3 shows actual order entry and modification messages rather than just the resulting book state. This gives professional participants microsecond-level visibility into market dynamics. The data includes order IDs allowing tracking of specific orders through their lifecycle.
Retail traders cannot access Level 3 data through normal brokerages. Exchanges reserve this level for registered market makers, broker-dealers, and institutional participants with direct market access systems. The infrastructure requirements and exchange memberships make this prohibitive for individual traders.
For practical purposes, Level 2 represents the deepest data available to retail traders. Understanding this limitation helps set realistic expectations about what you can see in the market.
Frequently Asked Questions
What is the difference between Level 1 and Level 2 market data?
Level 1 market data shows the best bid and ask prices (NBBO), last traded price, and basic volume information. Level 2 market data provides the complete order book showing multiple price levels, market depth, participant identities, and order sizes at each level. Level 1 gives you surface pricing while Level 2 reveals the underlying supply and demand dynamics.
What is L1, L2, and L3 market data?
Level 1 (L1) provides top-of-book data including best bid/ask prices and last trade. Level 2 (L2) adds the full order book with multiple price levels and market participant information. Level 3 (L3) includes everything in Level 2 plus order entry messages and execution capabilities, available only to market makers and institutional participants with direct exchange access.
Is Level 2 data worth it for retail traders?
Level 2 data is worth the cost for active day traders and scalpers who need precise entry and exit timing. Long-term investors and swing traders typically do not benefit enough to justify the monthly subscription fees. If you trade low-float stocks or make multiple intraday trades, Level 2 provides valuable information. For occasional traders or those using longer timeframes, Level 1 data suffices.
Can you get Level 2 data for free?
Most brokers charge subscription fees for Level 2 data, typically ranging from $10 to $100+ monthly depending on exchanges included. Some brokers offer promotional periods with free Level 2 access for new accounts or high-volume traders. A few platforms provide limited Level 2 functionality at no cost, though these often have delayed data or restricted exchange coverage. Free real-time Level 2 data for major exchanges is generally not available.
Conclusion
Understanding the difference between Level 1 vs Level 2 market data helps you choose the right information feed for your trading style. Level 1 provides essential pricing data suitable for long-term investors and beginners at minimal or no cost. Level 2 delivers comprehensive order book depth that benefits active day traders and scalpers willing to pay for enhanced visibility.
The decision ultimately depends on your trading timeframe and strategy. If you execute multiple trades per day or work with thinly traded securities, Level 2’s additional detail justifies the subscription expense. If you hold positions longer or trade primarily on technical analysis of price charts, Level 1 data provides everything you need without the complexity and cost.
Start with Level 1 to build your foundation, then consider upgrading to Level 2 once you consistently trade intraday and find yourself wanting more execution precision than basic data provides.