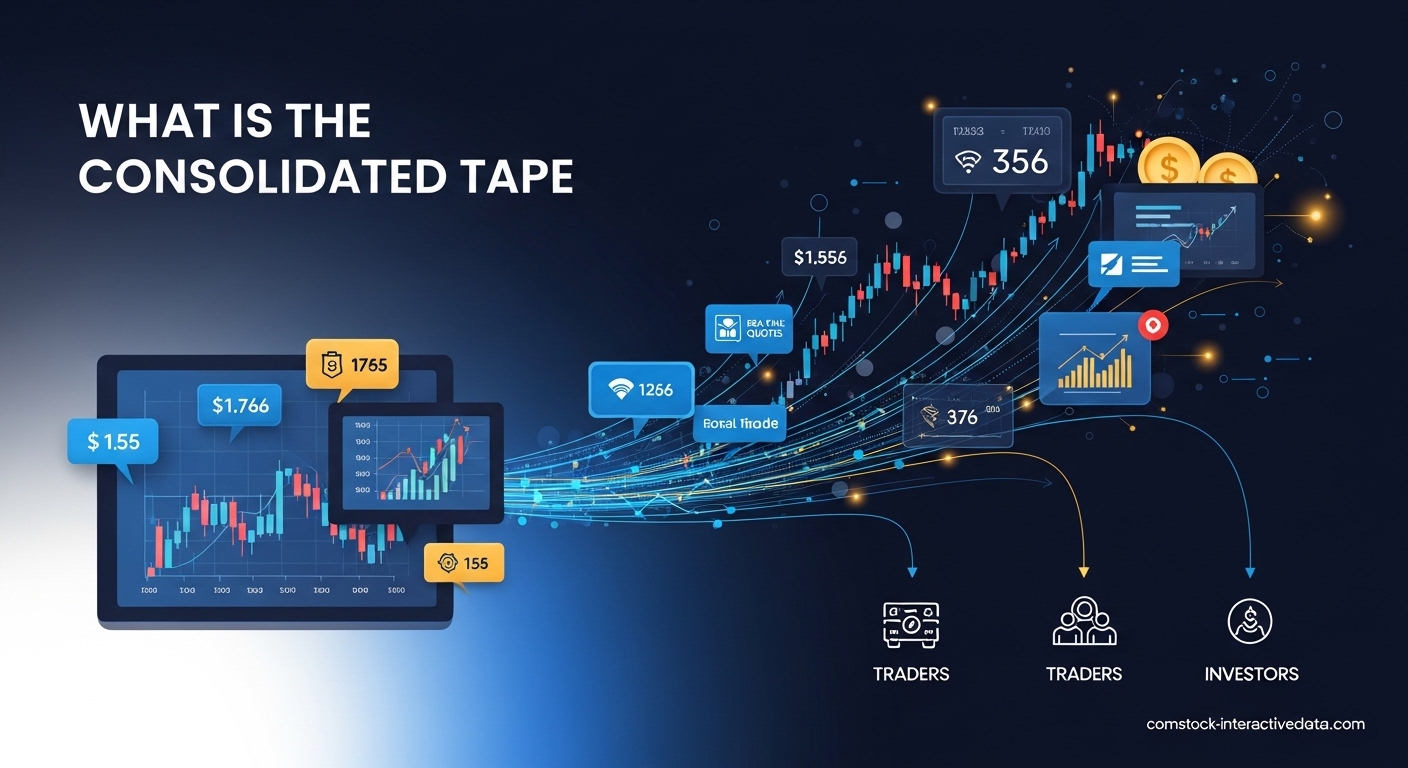
When you look at stock prices flashing across your trading screen, you are seeing the result of one of the financial world’s most important data systems. The consolidated tape serves as the backbone of market transparency, collecting and displaying real-time trade and quote data from every major exchange and trading venue across the United States. Understanding what is the consolidated tape and how does it work gives you essential insight into how markets function and where the price information you rely on actually comes from.
In this guide, I will walk you through everything you need to know about this critical market infrastructure. You will learn how trade data flows from exchanges to your screen, what information the tape contains, and why it matters for investors and traders in 2026. Whether you are an active day trader reading the tape for order flow clues or a long-term investor checking portfolio values, the consolidated tape affects every market decision you make.
Table of Contents
What Is the Consolidated Tape?
The consolidated tape is an electronic system that collects and reports real-time price and volume data for securities traded across multiple exchanges and trading venues. It serves as the official record of market activity, combining data from the NYSE, NASDAQ, regional exchanges, and electronic communications networks into a single unified stream.
This system was established to solve a fundamental problem in financial markets: fragmentation. Before the consolidated tape existed, each exchange maintained its own separate record of trades and quotes. Investors had no easy way to see the complete picture of market activity or know whether they were getting the best available price. The consolidated tape solved this by creating one authoritative source that shows trading activity across all venues simultaneously.
The system operates under the oversight of the Consolidated Tape Association (CTA), a group of exchange participants that administers the tape system under SEC supervision. The CTA ensures that all participating exchanges report their data consistently and that the consolidated information reaches market participants without delay.
Key Data Elements on the Consolidated Tape
The consolidated tape displays several essential pieces of information for each security. Understanding these data elements helps you interpret what you are seeing on your trading platform or financial website.
| Data Element | Description | Example |
|---|---|---|
| Ticker Symbol | Unique identifier for the security | AAPL, MSFT, TSLA |
| Last Sale Price | Price of the most recent trade | $175.43 |
| Trade Volume | Number of shares in last transaction | 500 shares |
| Bid Price | Highest price buyers are willing to pay | $175.40 |
| Ask Price | Lowest price sellers will accept | $175.45 |
| National Best Bid | Best bid across all venues | $175.40 |
| National Best Offer | Best offer across all venues | $175.45 |
| Trade Time | Timestamp of transaction | 09:45:23 EST |
| Exchange Code | Where trade/quote originated | N = NYSE, Q = NASDAQ |
Why the Consolidated Tape Matters?
Market transparency depends on the consolidated tape. Without it, investors would face information asymmetry where some market participants had better or faster access to pricing data than others. The tape ensures that everyone sees the same price information at essentially the same time, creating a level playing field.
Price discovery also relies heavily on this system. When buyers and sellers across all venues can see where others are willing to trade, markets become more efficient. The consolidated tape aggregates all this willingness-to-trade information, helping securities find their fair market value through the collective decisions of thousands of participants.
How Does the Consolidated Tape Work?
The consolidated tape operates through a sophisticated network of exchanges, processors, and data distributors working together in real-time. Understanding this flow helps you appreciate why some price updates reach you instantly while others might have slight delays depending on your data provider.
The process begins when a trade occurs or a quote changes at any participating exchange or trading venue. This could be a major exchange like the NYSE or a smaller electronic communications network handling off-exchange trades. Each venue is required to report its activity to a central Securities Information Processor (SIP) within specific time constraints measured in milliseconds.
The SIP serves as the consolidation engine. It receives data feeds from all connected venues, normalizes the formats to ensure consistency, and calculates the National Best Bid and Offer (NBBO). The NBBO represents the highest bid price and lowest ask price available across all venues for a given security, ensuring investors receive the best available price when their orders execute.
The Data Flow Process
The journey of a single trade from execution to your screen follows a specific path. First, a buyer and seller match at an exchange, creating a transaction. The exchange immediately reports this trade to the appropriate SIP with details including price, volume, time, and security identifier.
The SIP receives this data alongside reports from dozens of other venues simultaneously. It processes these inputs, updates the consolidated view of the market, and adds the trade to the official tape record. The SIP also recalculates the NBBO if this trade affects the best available prices.
Finally, the SIP broadcasts the updated information to all subscribers. These include brokerage firms, market data vendors, institutional trading systems, and retail trading platforms. The data travels through various networks until it reaches your trading screen, typically within fractions of a second of the original transaction.
Securities Information Processors (SIPs)
The SIP infrastructure consists of multiple processors handling different categories of securities. Network A SIPs handle NYSE-listed securities, Network B SIPs cover NYSE American and regional exchange listings, and Network C SIPs manage NASDAQ-listed securities. Each processor must meet strict performance and reliability standards set by the SEC and the CTA.
SIPs operate with extraordinary speed requirements. Modern systems process and disseminate data in microseconds, though the exact speed varies by implementation. Some market participants choose direct exchange feeds instead of consolidated SIP feeds to reduce latency even further, particularly for high-frequency trading strategies where every microsecond counts.
What Data Is Included on the Consolidated Tape?
The consolidated tape contains two primary categories of data: trade information showing what actually happened, and quote information showing what participants are willing to do. Both types of data serve different purposes for market analysis and trading decisions.
Trade Data Elements
Trade data captures actual transactions that have occurred. The last sale price shows the price of the most recent trade, giving you a benchmark for current market value. Trade volume indicates how many shares changed hands in that transaction, providing context about the size of the activity.
The tape also reports the exchange where each trade occurred. This venue attribution helps traders understand where liquidity is forming and which exchanges are handling the most activity for a particular security. Some trading strategies specifically track venue patterns to identify institutional order flow or detect large block trades being broken into smaller pieces.
Quote Data Elements
Quote data shows current buying and selling interest rather than completed transactions. The bid price represents the highest price any buyer is currently willing to pay, while the ask price (also called the offer) shows the lowest price any seller will accept. The difference between these prices is the spread, which represents the cost of immediate execution.
The National Best Bid and Offer (NBBO) sits at the heart of quote data. This consolidated view shows the single best available prices across all venues. SEC rules require brokers to execute customer orders at prices at least as good as the NBBO, protecting investors from getting worse prices than those available elsewhere in the market.
Quote data also includes size information showing how many shares are available at the best bid and ask prices. While the consolidated tape only shows the top of book (best prices), some data providers offer deeper book views showing additional price levels below the best bid and above the best ask.
Reading the Tape: Colors and Symbols
Traditional tape reading involved watching colors flash by to gauge market sentiment. Green text typically indicates an uptick, meaning the trade price is higher than the previous trade. Red indicates a downtick with a lower price than the last trade. White or black text indicates no price change.
These colors help traders quickly assess buying and selling pressure. A steady stream of green prints suggests aggressive buying, while predominantly red prints indicate selling pressure. Modern trading platforms often use this same color scheme, maintaining continuity with the visual language traders have used for over a century.
Ticker symbols on the tape sometimes include suffixes indicating special situations. These might show whether a trade occurred on a delayed basis, represents a seller shorting shares, or involves special settlement terms. Understanding these suffixes helps traders interpret unusual activity patterns correctly.
History and Evolution of the Consolidated Tape
The consolidated tape traces its lineage back to one of the most iconic inventions in financial history. Understanding this evolution helps explain why certain terminology and visual conventions persist in modern electronic systems.
From Ticker Tape to Electronics
In 1867, Edward Calahan invented the first stock ticker machine for the Gold and Stock Telegraph Company. This mechanical device printed stock prices on paper tape as they occurred at the exchange, allowing investors to track markets remotely for the first time. Thomas Edison improved the design in 1871, creating a more reliable version that became the industry standard.
For nearly a century, the ticker tape dominated financial information flow. Brokers and traders watched the tape in offices across the country, reading the rhythm of the market through the speed and direction of price prints. Fast-moving tape indicated heavy activity, while slow tape suggested quiet markets. This physical artifact shaped how generations of market participants thought about price information.
The transition to electronics began in the 1960s as trading volume overwhelmed mechanical systems. The SEC mandated a consolidated tape system in 1975 as part of broader market reforms, and the Consolidated Tape System (CTS) launched in April 1976. This electronic service collected data from multiple exchanges and distributed it electronically, eliminating the physical paper tape while preserving the conceptual framework.
Modern Developments
Today’s consolidated tape operates at speeds the inventors of the original ticker could never have imagined. Where early mechanical systems printed a few characters per second, modern electronic systems process millions of messages per second with microsecond precision. The volume of data has exploded as markets fragmented across dozens of trading venues and algorithmic trading became dominant.
Regulation NMS, implemented in 2007, significantly modernized the consolidated tape framework. It strengthened requirements for fair access to market data and established clearer standards for the NBBO calculation. These rules recognized that in an era of electronic trading and market fragmentation, the consolidated tape had become even more essential for market integrity.
Regulatory Oversight: The CTA and Networks A, B, and C
The consolidated tape does not operate in a vacuum. Multiple regulatory bodies and industry organizations collaborate to ensure the system works fairly and efficiently for all market participants.
The Consolidated Tape Association (CTA)
The CTA serves as the industry body administering the consolidated tape in the United States. Formed by participating exchanges, the association establishes operating procedures, manages data reporting requirements, and coordinates system upgrades. The CTA operates under SEC oversight, ensuring its actions align with regulatory priorities.
The association handles practical matters like setting fees for tape data, managing the SIP infrastructure contracts, and resolving disputes between participants. It also works to modernize the system, addressing challenges like increasing data volumes and emerging security types.
Understanding the Three Networks
The consolidated tape splits into three networks based on where securities are listed. This division reflects historical exchange structures, though modern trading means securities often trade across all venue types regardless of their listing location.
| Network | Coverage | Managed By | Securities |
|---|---|---|---|
| Network A | NYSE-listed securities | NYSE Group | Stocks listed on NYSE |
| Network B | NYSE American, regional exchanges | FINRA / CTA | Small-cap, regional listings |
| Network C | NASDAQ-listed securities | NASDAQ | NASDAQ stocks, ETFs |
Network A covers securities listed on the New York Stock Exchange, traditionally the largest and most prestigious US equity market. Network B handles securities from smaller exchanges including NYSE American and various regional exchanges. Network C covers NASDAQ-listed securities, which include many technology companies and exchange-traded funds.
SEC Oversight and Regulation
The Securities and Exchange Commission maintains ultimate authority over the consolidated tape through its market data rules. The SEC establishes performance standards for SIPs, mandates fair access to data, and approves any significant changes to tape administration or pricing.
Regulation NMS represents the most significant modern framework governing the consolidated tape. This regulation requires exchanges to make their quotes available to the SIP for NBBO calculation, ensures that investors receive prices at least as good as the NBBO, and establishes requirements for displaying and accessing market data. These rules attempt to balance the competing demands of market transparency with the commercial interests of exchanges that sell proprietary data feeds.
EU and UK Consolidated Tape Developments
While the United States has operated a consolidated tape for decades, Europe has been working to develop similar systems under different regulatory frameworks. These developments represent a significant shift in European market structure and offer important lessons for global market data policy.
The MiFID II Framework
The Markets in Financial Instruments Directive II (MiFID II), implemented in 2018, mandated the creation of a consolidated tape for European equities. Unlike the US system, which developed organically over decades, the European approach was deliberately constructed through regulation. MiFID II and its accompanying regulation (MiFIR) specified requirements for what the consolidated tape must include and how it should operate.
The European system faces more complex challenges than its American counterpart. Where the US has roughly a dozen major equity trading venues, Europe has hundreds across dozens of countries. Consolidating data from this fragmented landscape requires sophisticated technical infrastructure and extensive regulatory coordination.
ESMA, the European Securities and Markets Authority, has been working to designate consolidated tape providers (CTPs) under the MiFID II framework. The selection process has taken longer than initially expected due to the complexity of creating systems that can handle the volume and variety of European market data.
UK Developments Post-Brexit
The United Kingdom, having left the European Union, is developing its own consolidated tape approach under Financial Conduct Authority (FCA) supervision. The UK has expressed interest in creating a tape that could potentially include not just equities but also bonds and derivatives, going beyond what current EU plans cover.
The UK approach emphasizes reducing market data costs and improving transparency for fixed income markets. A bond consolidated tape would be particularly significant because bond markets traditionally operate with much less transparency than equity markets, with many trades occurring over-the-counter rather than on organized exchanges.
Both EU and UK developments are ongoing in 2026, with implementation timelines extending over several years. Market participants watching these developments anticipate significant changes in how they access European market data and what it will cost.
Modern Importance and Applications
The consolidated tape might seem like background infrastructure, but it plays an active role in modern trading strategies and investment decisions. Different market participants use the tape in different ways depending on their objectives and time horizons.
For Day Traders and Active Investors
Tape reading remains a core skill for many active traders. While the physical tape no longer exists, the principle of watching transaction flow to identify momentum and absorption patterns continues. Traders watch for large prints that suggest institutional activity, clusters of trades at specific price levels indicating support or resistance, and changes in the speed of trading that might signal impending moves.
Our team has observed that traders who combine tape reading with chart analysis often identify opportunities before they become obvious on price charts. The tape shows what is happening right now, while charts necessarily lag because they aggregate data into bars or candles. This real-time edge matters when trading intraday momentum.
Forum discussions among active traders reveal that data accuracy remains a top concern. Some traders prefer direct exchange feeds over consolidated SIP feeds to avoid any potential delays in the consolidation process. However, SIP data remains the standard for most retail platforms and provides sufficient speed for most trading strategies.
For Algorithmic and High-Frequency Trading
Algorithmic trading systems consume consolidated tape data as a primary input. These systems parse the feed to identify patterns, calculate signals, and trigger orders automatically. The standardized format of consolidated data makes it easier to build algorithms that work across multiple securities and venues without requiring custom integration for each exchange.
High-frequency trading firms often use direct exchange feeds rather than consolidated SIP feeds to minimize latency. The additional microseconds required for SIP processing, though minimal, matter when competing on speed. However, even HFT firms typically monitor the consolidated tape alongside direct feeds to ensure their view of the market matches the official record.
For Long-Term Investors
Long-term investors might not watch the tape tick by tick, but they benefit from its existence nonetheless. The consolidated tape enables the best execution requirements that protect investors from receiving poor prices on their orders. When you place an order through your broker, regulatory rules require that you receive a price at least as good as the NBBO shown on the consolidated tape.
The tape also supports market transparency that builds investor confidence. Knowing that all trading activity is reported and visible helps investors trust that markets operate fairly. This trust underpins market participation and liquidity, benefiting everyone from individual retirement accounts to large pension funds.
Frequently Asked Questions
How does consolidated tape work?
The consolidated tape works by collecting real-time trade and quote data from all exchanges and trading venues, processing it through Securities Information Processors (SIPs), and disseminating a unified data stream that shows the National Best Bid and Offer (NBBO) along with last sale prices and volume information.
Is tape reading still useful?
Yes, tape reading remains a valuable skill for active traders and day traders in 2026. While electronic markets have replaced physical trading floors, the principles of reading order flow, identifying absorption, and detecting momentum through the tape are still used by professional traders to gain insights before price movements appear on charts.
What is the difference between consolidated tape and ticker tape?
The ticker tape was the original mechanical system invented in 1867 that printed stock prices on paper tape. The consolidated tape is the modern electronic system that reports real-time data from multiple exchanges, providing a unified view of all trading activity rather than just one exchange’s data.
What do the colors mean on the consolidated tape?
Green text typically indicates an uptick (trade price higher than previous), red indicates a downtick (trade price lower than previous), and white or black indicates no change from the last trade. These colors help traders quickly identify buying or selling pressure.
Who oversees the consolidated tape?
The Consolidated Tape Association (CTA) oversees the consolidated tape system in the US, working under SEC supervision. The CTA manages the dissemination of real-time trade and quote data and coordinates between Networks A, B, and C.
Conclusion
The consolidated tape stands as one of the most important yet underappreciated systems in modern financial markets. From its origins as a mechanical ticker printing prices on paper tape to today’s electronic networks processing millions of messages per second, this infrastructure has consistently served the same fundamental purpose: ensuring that market participants see accurate, timely information about trading activity across all venues.
Understanding what is the consolidated tape and how does it work gives you better insight into the markets you participate in. Whether you are an active day trader reading the tape for order flow clues, an algorithmic trader building systems that consume market data feeds, or a long-term investor simply checking portfolio values, the consolidated tape affects your financial decisions. The transparency it provides underpins market fairness, supports price discovery, and ensures that investors receive the best available prices on their trades.
As markets continue evolving with new trading venues, emerging asset classes, and advancing technology, the consolidated tape will adapt alongside them. Regulatory developments in Europe and ongoing modernization efforts in the United States suggest that this essential market infrastructure will remain central to financial markets for decades to come.