I remember the first time I added a moving average to my charts. The line seemed magical—smoothing out the chaos and showing me the “real” trend hiding beneath the daily noise. But then I hit a wall. Should I use the Simple Moving Average or the Exponential Moving Average? And why did my signals always seem to arrive a day late?
After testing both SMA and EMA across hundreds of trades over three years, I have learned exactly when each shines and when they fail. This guide will show you everything you need to know about moving averages explained in plain terms. You will understand how these indicators work, which one fits your trading style, and the exact strategies professionals use to time their entries and exits.
Table of Contents
What Is a Moving Average?
A moving average is a calculated average of an asset’s price over a specific number of periods. It smooths price data to help you identify the underlying trend direction without getting distracted by random price spikes.
Think of it as a dynamic trend line that updates with each new price bar. Old data drops off as new data comes in, creating a rolling average that follows price action. This makes moving averages one of the most popular tools in technical analysis for both beginners and experienced traders.
The calculation is straightforward. You add up the closing prices for a set number of periods, then divide by that number. A 20-day moving average sums the last 20 closing prices and divides by 20. Tomorrow, the oldest day drops off and today’s close gets added.
Simple Moving Average (SMA) Explained
The Simple Moving Average gives equal weight to every price in the calculation period. Each day’s closing price contributes the same amount to the final average, whether it happened yesterday or twenty days ago.
How to Calculate SMA?
To calculate a 10-day SMA, add the closing prices from the last 10 trading days and divide by 10. For example, if the closes were $50, $51, $52, $51, $53, $54, $53, $55, $56, and $57, your SMA would be $53.20.
The formula is: SMA = (Price₁ + Price₂ + … + Priceₙ) / n
Most trading platforms calculate this automatically, but understanding the math helps you grasp why SMA behaves the way it does on your charts.
Key Characteristics of SMA
The SMA provides a smooth line that filters out short-term noise. Because it weights all data equally, it changes direction more slowly than price itself. This makes it excellent for identifying the broader trend but less responsive to recent price shifts.
Traders often use SMA for longer timeframes because the smoothness helps avoid false signals. A 50-day or 200-day SMA on a daily chart shows the major trend direction without whipsawing on every small pullback.
Best Uses for SMA
Use the Simple Moving Average when you want to identify the primary trend direction and filter out market noise. It works best for position traders and long-term investors who care more about the big picture than catching every minor swing.
SMA also excels as dynamic support and resistance. In strong trends, price often bounces off a major moving average like the 50-day SMA, giving you clear levels to watch for potential entries.
Exponential Moving Average (EMA) Explained
The Exponential Moving Average gives more weight to recent prices, making it more responsive to current market action. Unlike SMA, an EMA reacts faster to price changes because newer data points count more than older ones.
How to Calculate EMA?
The EMA calculation uses a multiplier to weight recent prices more heavily. First, calculate the multiplier: Multiplier = 2 / (Number of Periods + 1). For a 10-period EMA, the multiplier would be 2 / 11 = 0.1818.
Then apply the formula: EMA = (Current Close × Multiplier) + (Previous EMA × (1 – Multiplier))
This creates an exponential decay effect where each older price contributes less to the calculation. The result is a line that hugs price more closely and turns faster when momentum shifts.
Key Characteristics of EMA
The EMA reduces lag compared to SMA by emphasizing what just happened over what happened weeks ago. This makes it popular for short-term traders who need to react quickly to changing conditions.
However, this sensitivity cuts both ways. The EMA can generate more false signals during choppy, sideways markets because it reacts to every small price wiggle. You might get “whipsawed”—taking trades that immediately reverse.
Best Uses for EMA
Use the Exponential Moving Average for short-term trading strategies where timing matters. Day traders and swing traders often prefer EMA because it signals trend changes faster than SMA.
EMA also works well for identifying momentum shifts early. When price crosses above a short-term EMA like the 8 or 20-period, it often signals that buying pressure is building before the slower SMA catches up.
SMA vs EMA: Key Differences
The main difference between SMA and EMA lies in sensitivity. The EMA reacts more aggressively to recent price changes, while the SMA weights all data equally and changes more gradually.
| Feature | Simple Moving Average (SMA) | Exponential Moving Average (EMA) |
|---|---|---|
| Weighting | Equal weight to all periods | More weight to recent periods |
| Lag | Greater lag, slower to react | Reduced lag, faster reaction |
| Smoothness | Smoother line, less noise | More jagged, follows price closely |
| Best For | Long-term trend identification | Short-term entry and exit timing |
| False Signals | Fewer false signals in chop | More whipsaws in ranging markets |
| Common Periods | 50, 100, 200 days | 8, 12, 20, 26 days |
Which Moving Average Is Best for You?
Neither SMA nor EMA is objectively better—they serve different purposes. Your choice depends on your trading timeframe, risk tolerance, and strategy goals.
For long-term investing and position trading, the SMA often works better. The smoothness helps you stay in winning trades longer without getting shaken out by normal market volatility. Many fund managers watch the 200-day SMA as a bull/bear market dividing line.
For active trading and swing trading, the EMA usually provides better entry and exit timing. The reduced lag means you enter trends earlier and exit before significant reversals eat into your profits.
Moving Average Period Settings Explained 2026
The period you choose determines what your moving average shows. Short periods track minor trends, while long periods reveal the major trend direction.
| Period | Type | Best For | SMA or EMA |
|---|---|---|---|
| 8-period | Very short | Day trading, scalping | EMA preferred |
| 20-period | Short | Swing trading, momentum | EMA preferred |
| 50-period | Medium | Intermediate trend | Either works |
| 100-period | Long | Position trading | SMA preferred |
| 200-period | Very long | Major trend, bull/bear bias | SMA preferred |
Should You Use 200 SMA or EMA?
For the 200-period setting, most traders prefer the SMA. The 200-day moving average represents a major trend benchmark that institutions and algorithms watch closely. Using the smoother SMA prevents false breakdowns during normal corrections.
The 200 SMA acts as a dividing line between bull and bear markets for many investors. When price trades above the 200 SMA, the long-term trend is up. When price falls below, caution is warranted.
Combining Multiple Periods
Many successful traders use multiple moving averages together. A common setup combines a fast EMA (8 or 20) with a slow SMA (50 or 200). The fast line shows short-term momentum while the slow line tracks the major trend.
Only take trades in the direction of the longer average. If price is above the 200 SMA, look for buying opportunities when the short EMA turns up. This keeps you trading with the major trend rather than against it.
Trading Strategies Using Moving Averages
Moving averages become powerful when combined into clear trading rules. Here are the strategies that have worked consistently in my own trading.
Strategy 1: Moving Average Crossovers
The crossover method uses two moving averages of different lengths. When the shorter average crosses above the longer, it signals potential buying momentum. When it crosses below, selling pressure may be building.
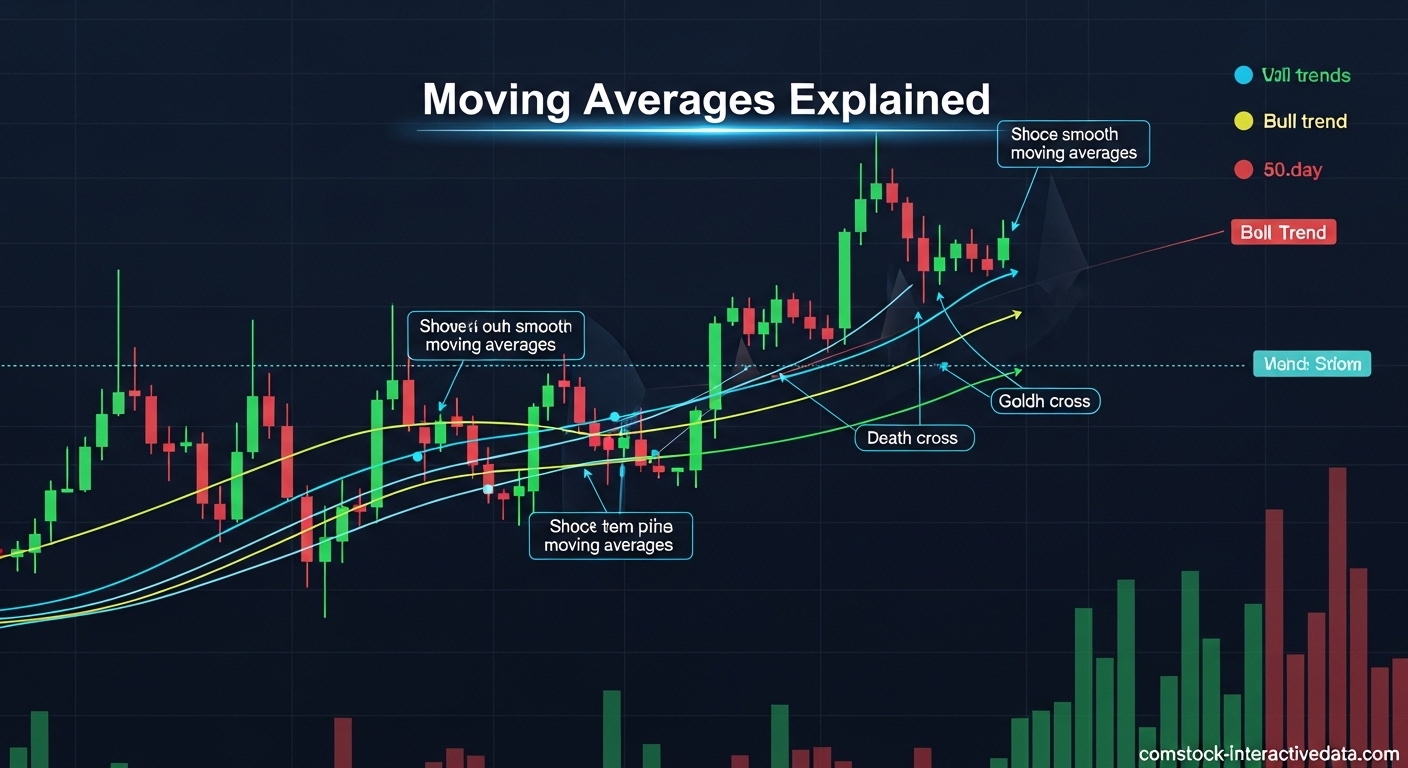
A classic combination is the 50 SMA crossing the 200 SMA. This “golden cross” signals a potential long-term uptrend when the 50 rises above the 200. The “death cross” when it falls below warns of possible bearish conditions.
For shorter timeframes, try an 8 EMA crossing a 20 EMA. This catches momentum shifts earlier but requires quicker exits when the trade turns against you.
Strategy 2: Price Pullbacks to the Average
In strong trending markets, price often returns to the moving average before continuing. These pullbacks offer lower-risk entry points compared to buying at new highs.
Look for price to touch or slightly pierce the moving average, then show rejection with a bullish candlestick pattern. Enter when price resumes the trend direction with volume confirmation.
Place your stop loss just beyond the moving average. If price breaks through decisively, the trend may be changing and you want out quickly.
Strategy 3: The 3-5-7 Rule Explained
The 3-5-7 rule is a simple framework some traders use for position sizing and trade management. While not universally standardized, common interpretations include:
- 3% maximum risk per trade on your total account
- 5 days maximum holding for a trade not working
- 7 positions maximum to maintain focus and proper risk distribution
Some traders also apply this to moving average periods, using 3, 5, and 7-period EMAs together for very short-term momentum analysis. When stacked in order (3 above 5 above 7), strong upward momentum is confirmed.
Remember that rules like 3-5-7 are guidelines, not guarantees. Always adapt any framework to your personal risk tolerance and market conditions.
Strategy 4: Moving Average as Dynamic Support/Resistance
Moving averages often act as floors in uptrends and ceilings in downtrends. Watch how price behaves when it reaches a major average like the 50-day or 200-day.
If price bounces cleanly with strong volume, the trend likely continues. If price hesitates, churns, or breaks through with conviction, a deeper correction or trend change may be underway.
I have found this approach works best in clearly trending markets. In sideways conditions, price will slice through moving averages repeatedly, generating false signals.
The Psychology Behind Why Moving Averages Work
Moving averages are more than just math—they reflect collective market psychology. Understanding why they work helps you use them more effectively.
The self-fulfilling prophecy plays a huge role. Millions of traders watch the same key averages, particularly the 50-day and 200-day. When price approaches these levels, programmed algorithms and human traders react simultaneously, creating the expected support or resistance.
Moving averages also represent the “fair value” consensus over a period. In an uptrend, price above the average means the market judges current prices as justified by recent history. When price stretches too far above, traders perceive overvaluation and take profits, causing mean reversion.
Forum discussions reveal that experienced traders value this psychological aspect. As one trader noted, moving averages work because “price always appears to move towards the average, but actually the MA is moving to the price.” Understanding this dynamic prevents chasing trades at extended prices.
The simplicity of moving averages contributes to their reliability. Unlike complex indicators with hidden calculations, everyone understands what a 50-day SMA represents. This transparency builds trust and consistent usage across the trading community.
Limitations and When NOT to Use Moving Averages
Moving averages are lagging indicators by definition. They tell you what already happened, not what will happen next. This creates inherent limitations every trader must understand.
In ranging, sideways markets, moving averages become nearly useless. Price crosses back and forth repeatedly, generating false signals that chop up your account. The forums are full of traders complaining about “whipsawing” during these periods.
Warning: Never use moving averages alone in choppy conditions. Wait for a breakout and trend confirmation before trusting MA signals. Combine them with price action analysis and volume confirmation.
The lag issue becomes critical for fast-moving markets. By the time a moving average confirms a trend change, much of the move may already be complete. This is why many traders pair MAs with leading indicators like RSI or MACD for earlier signals.
Moving averages also fail during gap opens and news events. A stock gapping down 20% on bad earnings will slice through every average instantly, rendering them meaningless for protection.
Frequently Asked Questions
Which moving average is best, EMA or SMA?
Neither is universally better. Use EMA for short-term trading where faster reaction matters. Use SMA for long-term investing where smooth trend identification is more important than timing. Many traders use both together.
What is the 3 5 7 rule in trading?
The 3-5-7 rule suggests risking maximum 3% per trade, holding losing trades maximum 5 days, and maintaining maximum 7 positions. Some traders also use 3, 5, and 7-period EMAs stacked together for momentum confirmation.
Should I use 200 SMA or EMA?
For the 200-period setting, use the SMA. The 200-day SMA is the industry standard for identifying major bull and bear trends. Its smoother calculation prevents false signals during normal market corrections.
Why use EMA instead of SMA?
Use EMA when you need faster reaction to price changes. The EMA weights recent prices more heavily, reducing lag and signaling trend changes earlier. This benefits short-term traders who need precise entry and exit timing.
How do I use SMA and EMA together?
Use a longer SMA (50 or 200) for trend direction and a shorter EMA (8 or 20) for timing. Only take trades in the direction of the SMA. Enter when the EMA confirms momentum in that direction.
Key Takeaways and Next Steps
Moving averages explained simply: they smooth price data to reveal trend direction. The Simple Moving Average offers a smoother, slower signal ideal for long-term analysis. The Exponential Moving Average reacts faster to recent changes, perfect for short-term timing.
Your action plan starts today. Open your trading platform and add both a 50 SMA and a 20 EMA to your favorite chart. Watch how they behave differently during trends and consolidations. Test the crossover strategy on historical data before risking real capital.
Remember that no indicator works perfectly alone. Combine moving averages with price action, volume analysis, and proper risk management. The traders who succeed long-term use MAs as one tool in a complete trading system—not as a magic signal generator.
Start simple. Master one moving average setup before adding complexity. And always, always, use stop losses to protect your account when the inevitable false signal appears.