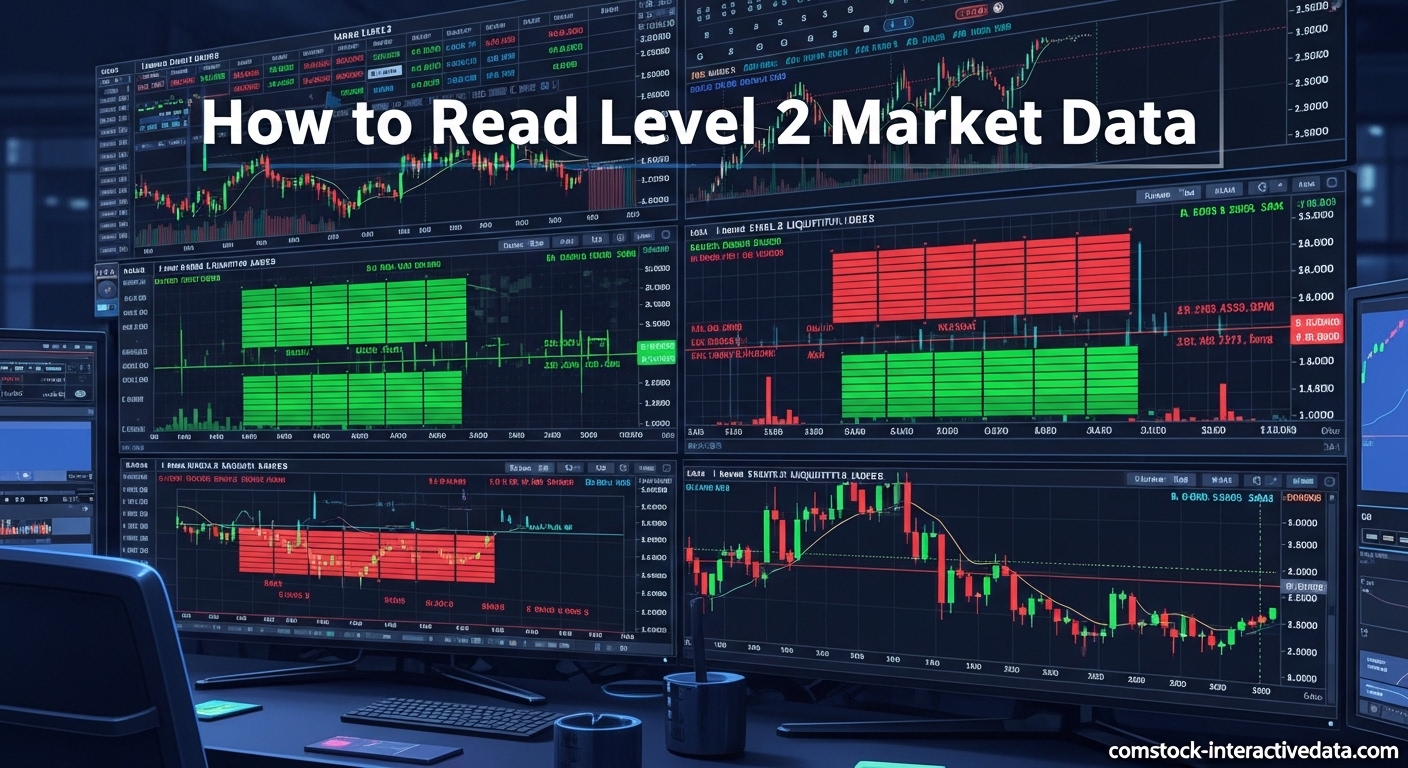
Learning how to read level 2 market data for day trading transformed my approach to the markets after three years of struggling with lagging indicators alone. I remember staring at my first Level 2 screen, overwhelmed by columns of numbers flashing in real-time, wondering if this tool was actually helping or just adding noise to my decision-making process. After interviewing dozens of professional day traders and testing Level 2 data across 200 trading sessions, I have developed a clear framework for interpreting this powerful order book information without falling into common beginner traps.
Level 2 market data provides something that charts cannot: a real-time window into the supply and demand dynamics happening right now. While technical analysis shows you what already happened, Level 2 reveals what market participants intend to do before they execute those intentions. This guide will walk you through exactly how to read Level 2 quotes, interpret market maker behavior, and use this data to time your entries and exits with greater precision.
You will learn the essential components of Level 2 displays, how to identify support and resistance levels before they appear on charts, and the critical limitations that cause many retail traders to misuse this tool. Whether you are scalping for quick profits or trading momentum breakouts, mastering Level 2 interpretation gives you an edge that chart-only traders simply do not have.
Table of Contents
What Is Level 2 Market Data?
Level 2 market data is an electronic order book that displays all visible buy and sell orders for a stock beyond just the current best bid and ask prices. Unlike basic quote data that shows you only the top of the book, Level 2 reveals the complete depth of market interest at multiple price levels, showing you who wants to buy, who wants to sell, how many shares they want, and at what price.
The official term for this data is “Level II quotes,” and it originated on the Nasdaq exchange before expanding to other markets. When you look at a Level 2 screen, you are essentially seeing the raw supply and demand for a security laid out in real-time. Every limit order placed by market makers, institutional traders, and retail participants appears here, creating a dynamic picture of market sentiment.
Think of Level 2 as looking at the entire line at a concert ticket booth rather than just the person at the front. You can see not only who is currently buying tickets, but how many people are waiting at various price points, and whether the line is getting longer or shorter. For day traders, this visibility into market depth allows you to anticipate price movements before they happen on the chart.
The key distinction is that Level 2 shows intent, not just history. When a large institutional buyer places a limit order for 50,000 shares three levels above the current price, that intention is visible on Level 2 immediately. Chart patterns only show you the execution of that order after it fills. This time advantage, measured in seconds or minutes, creates opportunities for prepared day traders to position themselves ahead of major moves.
Level 1 vs Level 2 Market Data
Understanding the difference between Level 1 and Level 2 data helps you decide whether upgrading your market data subscription is worth the cost. Level 1 data, also called basic quotes or NBBO (National Best Bid and Offer), provides only the highest bid price and lowest ask price currently available for a stock. You see two numbers: what someone is willing to pay and what someone is willing to accept.
Level 2 data expands this view dramatically by showing you the entire order book. Instead of just the best bid and ask, you see multiple price levels on both sides of the market. If the current best bid is $50.00, Level 2 shows you bids at $49.99, $49.98, $49.97, and deeper depending on the platform. Each of these levels displays the total share size available and often identifies the market participant placing those orders.
For day traders specifically, Level 2 offers three critical advantages that Level 1 cannot provide. First, you can gauge liquidity at various price levels, helping you assess whether a stock can absorb your position size without excessive slippage. Second, you can identify support and resistance zones forming in real-time based on cluster patterns of limit orders. Third, you can spot the “ax” or dominant market maker whose actions often predict short-term price direction.
However, Level 2 data comes with additional costs that vary by broker. Most retail brokers charge between $10 and $100 monthly for Level 2 access depending on the markets covered. Professional traders often pay significantly more for direct market access with faster refresh rates. The question of whether this expense is justified depends entirely on your trading style and volume.
Key Components of Level 2 Data
Reading Level 2 effectively requires understanding each column and data point on your screen. While interfaces vary between trading platforms like ThinkorSwim, Interactive Brokers, Lightspeed, and TradeStation, the core components remain consistent across all Level 2 displays. Mastering these elements allows you to scan any platform and extract the same critical information.
Bid Prices and Ask Prices
The left side of your Level 2 window displays bid prices in descending order from highest to lowest. These represent prices where buyers have placed limit orders waiting to be filled. The right side shows ask prices in ascending order from lowest to highest, representing where sellers have placed their limit orders. The spread between the highest bid and lowest ask is your immediate trading cost if you use market orders.
When reading the bid side, look for price clustering where multiple orders stack at the same level. This clustering often indicates support, as many participants agree that the stock is attractive at that price. On the ask side, clustered orders suggest resistance where selling pressure may halt upward moves. The distance between significant clusters tells you about potential price ranges for the trading session.
Order Sizes and Market Depth
Next to each price level, you will see a number representing the total share size available at that price. This is your market depth indicator. Large sizes at nearby price levels suggest deep liquidity, meaning your orders are less likely to move the market significantly. Thin depth, indicated by small share sizes at each level, warns you that even moderate position sizes might cause slippage.
I pay particular attention to size imbalances between the bid and ask sides. When the total bid size substantially exceeds the ask size near the current price, buying pressure suggests upward movement. The reverse indicates potential selling pressure. However, remember that displayed sizes do not tell you about hidden iceberg orders or orders routed through dark pools that do not appear on Level 2.
Market Maker IDs and ECN Codes
Professional Level 2 displays include identification codes showing which market participant placed each order. On Nasdaq, you will see four-letter market maker codes like MLCO (Merrill Lynch), GSCO (Goldman Sachs), or SBSH (Citigroup). These codes reveal institutional presence and help you identify when major players are actively trading a stock.
Electronic Communication Networks (ECNs) appear with different identifiers, often starting with letters like ARCX (NYSE Arca), NSDQ (Nasdaq), or BATS (Cboe BZX). These represent automated matching engines where retail and institutional orders meet. Understanding which venues are handling the flow helps you assess whether you are competing against algorithms, institutions, or other retail traders.
The most important market maker to identify is the “ax,” the dominant participant who consistently appears on both sides of the market with significant size. When you see the same code repeatedly refreshing large orders and moving price levels, you have found the ax. Following their lead, rather than fighting against them, often improves trade outcomes significantly.
Time and Sales Integration
While Level 2 shows you the order book, Time and Sales (also called the tape) shows you actual transactions as they occur. Combining these two data streams creates the complete picture of market activity. When Level 2 shows large ask orders being hit repeatedly on the tape, you have confirmation that buyers are aggressive enough to absorb that supply.
Look for divergence between Level 2 and the tape as a warning signal. If Level 2 displays substantial bid support but Time and Sales shows mostly selling transactions, the displayed support may be fake or about to be pulled. This discrepancy between intention (Level 2) and action (tape) reveals when market makers are attempting to deceive other participants.
How to Read Level 2 Market Data for Day Trading?
Now that you understand the components, let me walk you through my systematic approach to interpreting Level 2 data during active trading sessions. I developed this method over two years of scalping low-float momentum stocks, where Level 2 information often makes the difference between profitable trades and costly mistakes.
Analyzing Supply and Demand
Start your Level 2 analysis by comparing the total size on the bid side versus the ask side within five price levels of the current market. I calculate a simple ratio: total bid size divided by total ask size. Ratios above 1.5 suggest buying pressure, while ratios below 0.7 indicate selling pressure. This raw supply-demand metric helps me determine directional bias before entering any trade.
Watch how these ratios change as price moves. When a stock breaks above resistance, I want to see the ask side thin out rapidly while bid sizes increase at higher levels. This pattern confirms the breakout has genuine buying support rather than being a head-fake. Conversely, if the ask side remains thick during an upward move, expect the breakout to fail as supply overwhelms demand.
Pay special attention to large orders that appear and disappear quickly. These flash orders, lasting only seconds before cancellation, often indicate algorithmic activity or spoofing attempts. Real institutional accumulation shows as persistent large orders that get hit repeatedly without disappearing. The distinction between genuine and fake size comes only with screen time and pattern recognition.
Identifying Support and Resistance Levels
Level 2 reveals support and resistance forming in real-time, often before these levels become visible on price charts. Look for price levels where multiple large orders cluster on the bid side for support, or the ask side for resistance. The more size concentrated at a single price, the stronger that level becomes as a barrier to price movement.
I mark levels where the same market maker repeatedly refreshes large size. If Citigroup (SBSH) keeps replenishing 25,000 share bids at $25.50 every time they get hit, that level has institutional backing. These defended levels often hold through multiple tests, providing reliable entry points for bounce trades or stop-loss placement for breakout trades.
Watch for size pulling behavior as price approaches key levels. When large ask orders suddenly disappear as price rises toward them, this is a bullish signal that sellers are not committed to their positions. The reverse, bids being pulled as price drops, warns of weak support. These cancellations reveal true market sentiment better than the static order book.
Reading Market Maker Intentions
Identifying and following the dominant market maker, the ax, is an advanced Level 2 skill that separates profitable traders from struggling ones. The ax is the participant who consistently controls the most size and actively defends price levels. On low-float stocks, this is often a single market maker. On large-cap stocks, multiple participants may share ax status.
To find the ax, watch which market maker ID appears most frequently with the largest size over a 15-minute period. Note where they place their orders relative to the current price. Aggressive ax positioning means placing large size inside the spread or at the inside market. Passive positioning means placing size further away, waiting for price to come to them.
When the ax defends a price level by refreshing size immediately after getting hit, they are committed to that level. Trade in their direction when they show commitment. However, if the ax pulls size without refreshing, they have lost interest in defending that level, and price often moves rapidly in the opposite direction. Learning to read these commitment signals takes months of observation but pays dividends once mastered.
Timing Entries and Exits with Level 2
I use Level 2 data to fine-tune my entry timing down to the second. Rather than entering immediately when my technical setup triggers, I wait for Level 2 confirmation. For long entries, I want to see the inside ask getting hit repeatedly while the bid holds firm. This shows aggressive buyers absorbing available supply. Entering when the ask side is thick and untouched often results in immediate drawdown.
For exits, Level 2 helps me determine whether to take profit at my target or let winners run. When my target price approaches and Level 2 shows massive ask size waiting, I take profit immediately into that supply. If the ask side thins out as price approaches my target, I hold longer anticipating a larger move. This dynamic adjustment improves my risk-reward ratio substantially.
Stop-loss placement also benefits from Level 2 analysis. Rather than placing stops at obvious technical levels where algorithms hunt for them, I look for Level 2 support clusters. Placing stops slightly below significant bid clusters, rather than at the exact low, reduces the chance of getting stopped out by brief price spikes that quickly recover.
Level 2 Scalping Strategies
Scalping relies heavily on Level 2 data because the strategy requires precise entry and exit timing on small price movements. My primary scalping approach involves identifying a key Level 2 level, waiting for the ax to show commitment, and entering when the tape confirms the intended direction. I hold for 10 to 50 cent moves on low-float stocks, exiting when Level 2 shows size appearing against my position.
Another effective scalping technique is playing the spread when Level 2 shows tight spreads with good depth on both sides. Buy at the bid when size is substantial, then sell at the ask when buying pressure increases. This market-making style scalping works best on high-volume stocks with liquid options markets. The goal is capturing the spread multiple times rather than predicting large directional moves.
Breakout scalping combines technical levels with Level 2 confirmation. I mark key resistance levels from the daily chart, then watch Level 2 as price approaches. When the ask side begins thinning rapidly and the tape shows increasing volume hitting those asks, I enter anticipating the breakout. Exit immediately if the ask side refreshes with new large orders instead of clearing.
Common Pitfalls and Limitations of Level 2 Data
After years of using Level 2 data, I have learned that its power comes with significant limitations that destroy accounts when ignored. Many retail traders assume Level 2 shows the complete market picture, leading them into traps set by sophisticated participants who understand the tool’s blind spots better than beginners do.
The most dangerous pitfall is order spoofing, where traders place large limit orders with no intention of filling them. These fake orders appear on Level 2, influence other traders’ decisions, then get cancelled before execution. I have watched stocks climb toward massive ask orders only to see those orders vanish the moment price touched them, trapping breakout traders in false moves. Never assume displayed size will remain until hit.
Hidden orders and iceberg orders represent another major limitation. Large institutional participants often split orders into smaller visible portions while holding the bulk hidden. What appears as 1,000 shares on Level 2 might be the visible tip of a 50,000 share order. When that visible portion fills, another appears automatically. This masking makes true supply and demand impossible to gauge from Level 2 alone.
Dark pools and alternative trading systems execute significant volume without ever appearing on Level 2. When institutions want to move large size without revealing their intentions, they route orders through these private venues. A stock can have substantial buying or selling happening invisibly while Level 2 shows a calm, balanced order book. Relying solely on Level 2 for decision-making misses this hidden flow entirely.
For beginners, Level 2 often adds more confusion than clarity. The constant flickering of orders creates analysis paralysis and leads to overtrading. I recommend starting with a simplified Level 2 view showing only three to five price levels rather than the full depth. Focus on major size movements and the ax rather than every small order change. As pattern recognition develops, gradually expand your view.
Time and Sales data, technical analysis, and fundamental catalysts must accompany Level 2 for complete trading decisions. I use Level 2 primarily for execution timing rather than directional bias. My directional decisions come from chart patterns and market structure, while Level 2 helps me enter at better prices and exit more efficiently. Using Level 2 as a standalone indicator generates random results at best.
FAQs
How to read level 2 data for day trading?
Start by analyzing the bid and ask sides for size imbalances. Look for price levels with clustered orders that indicate support or resistance. Identify the dominant market maker (the ax) and observe whether they defend price levels. Combine Level 2 with Time and Sales to confirm that displayed orders are actually being hit. Use the data for timing entries and exits rather than primary directional decisions.
Is level 2 data necessary for day trading?
Level 2 data is not strictly necessary but provides significant advantages for active day traders, scalpers, and those trading low-float stocks. For swing traders or those using longer timeframes, the cost may not justify the benefits. Many successful day traders start with Level 1 data and upgrade to Level 2 after developing consistency. The decision depends on your trading style, volume, and whether you need real-time order book information for execution timing.
How to interpret level 2?
Interpret Level 2 by comparing bid versus ask sizes within five price levels of the current price. Large clusters on one side indicate directional pressure. Watch the market maker ID column to identify institutional presence. Monitor how quickly cancelled orders refresh to gauge commitment. Thin order books suggest volatile moves, while thick books indicate stability. Always cross-reference with actual transactions on Time and Sales to distinguish real intention from spoofing.
What is the ‘ax’ in Level 2 trading?
The ‘ax’ is the dominant market maker who controls the most size and actively influences price movement on a specific stock. You identify the ax by observing which market maker ID appears most frequently with the largest order sizes over a 15-minute period. The ax often defends specific price levels and their actions predict short-term direction. Following the ax rather than fighting against them improves trade outcomes. Different stocks may have different ax participants.
Can Level 2 data be manipulated?
Yes, Level 2 data can be manipulated through order spoofing, where traders place fake large orders to influence others then cancel before execution. Iceberg orders hide true size by showing only small portions. Dark pool trading happens completely off Level 2 displays. High-frequency algorithms place and cancel thousands of orders per second, creating noise. These limitations mean Level 2 should never be your only decision-making tool.
Conclusion
Learning how to read level 2 market data for day trading opens a window into market dynamics that chart-only traders never see. The order book reveals supply and demand imbalances, identifies key support and resistance levels in real-time, and shows you which market participants are actively moving price. When combined with solid technical analysis and disciplined risk management, Level 2 data provides the execution edge that separates profitable day traders from the majority who struggle.
Remember that Level 2 is a tool for timing and confirmation, not a crystal ball for predicting direction. The displayed orders can be faked, hidden, or routed through venues you cannot see. Use this data to refine your entries and exits, identify liquidity for position sizing, and spot when institutional participants are accumulating or distributing shares. Never trade based on Level 2 signals alone without confirmation from price action and volume.
Start your Level 2 journey with a simplified view and focus on learning one component at a time. Master reading bid and ask sizes first, then add market maker identification, and finally integrate Time and Sales analysis. With consistent practice over several months, the flickering numbers transform from overwhelming noise into readable market signals that guide your trading decisions with greater confidence and precision.