Market data normalization is the process of converting financial data from various source formats across different exchanges into a single, standardized format that enables consistent analysis and comparison. Every major exchange outputs data differently. NYSE uses one wire protocol, NASDAQ uses another, and CME has its own format entirely. This fragmentation creates massive headaches for traders, quants, and developers who need to work with multiple markets simultaneously.
I have spent years working with raw exchange feeds, and the inconsistency is staggering. One exchange reports prices in cents, another in dollars. Timestamps come in different timezones. Symbol identifiers vary wildly between venues. Without normalization, you are forced to write custom code for every data source. This multiplies your maintenance burden and introduces subtle bugs that can cost real money.
In this guide, I will walk you through exactly how market data normalization works across multiple exchanges. You will learn the step-by-step process, key normalization techniques, and practical implementation tips. Whether you are building algorithmic trading systems, conducting quantitative research, or managing risk across global markets, this information will save you months of trial and error.
Table of Contents
What Is Market Data Normalization?
Market data normalization transforms raw exchange feeds into a unified, consistent data format. The process takes heterogeneous data sources and converts them into a homogeneous structure that your applications can consume seamlessly. Think of it as a universal translator for financial market data.
Each exchange uses proprietary data formats for historical and business reasons. NYSE developed its systems decades ago using specific binary protocols. NASDAQ built its infrastructure with different technology choices. European and Asian exchanges each have their own conventions. These differences include field ordering, data types, timestamp precision, and message structures.
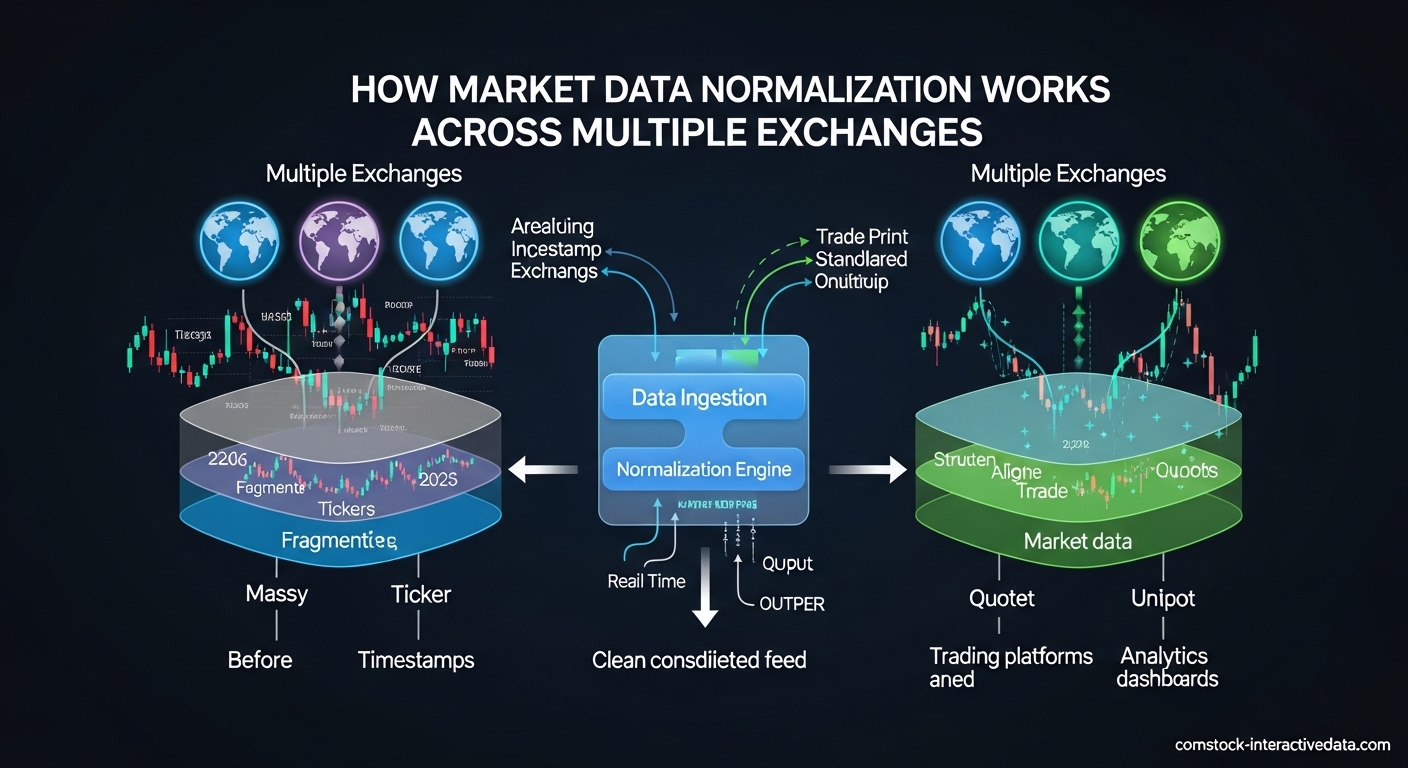
Normalization sits between your data sources and your applications. It ingests raw feeds from multiple exchanges, applies transformation rules, and outputs standardized data streams. The normalized data contains the same market information but in a consistent schema that your trading algorithms, risk systems, and analytics tools can process uniformly.
The goal is abstraction without information loss. Proper normalization preserves every bit of market data while eliminating format differences. A price update from NASDAQ should look identical to a price update from BATS after normalization. The venue information gets preserved as a metadata field, but the core data structure becomes uniform.
How Market Data Normalization Works Across Multiple Exchanges?
The normalization process follows a clear pipeline from raw ingestion to standardized output. Understanding each step helps you design better data infrastructure and troubleshoot issues when they arise. Here is the complete workflow used by professional data vendors and trading firms.
Step 1: Data Ingestion and Protocol Parsing
Raw market data arrives via multicast feeds, TCP connections, or file transfers depending on the exchange. Each venue uses specific wire protocols like FIX, ITCH, OUCH, or proprietary binary formats. The ingestion layer must understand these protocols to decode the incoming byte streams into structured messages.
Packet capture (PCAP) technology often sits at this layer to record raw network traffic. PCAP files serve as the source of truth for verification. If your normalized output shows anomalies, you can replay the PCAP to determine whether the error occurred during ingestion or transformation.
Step 2: Message Decoding and Field Extraction
Once ingested, the raw bytes get parsed according to exchange specifications. Each message type (trade, quote, order book update) has a defined structure. The decoder extracts individual fields like price, quantity, timestamp, and symbol identifier from their binary representations.
This step requires deep knowledge of exchange specifications. NASDAQ ITCH 5.0 defines different message types for add order, modify order, delete order, and trade execution. Each message has specific byte offsets for each field. CME uses a completely different encoding scheme. Your normalization system needs parsers for every exchange you support.
Step 3: Symbol Mapping and Standardization
Exchanges use different symbol conventions that must be mapped to a standard format. NYSE might use “IBM” while another venue uses “IBM.N” or a numeric identifier. The normalization layer applies symbol mapping rules to convert venue-specific identifiers to a canonical representation like ISIN, FIGI, or your internal symbology.
Corporate actions complicate this process. Stock splits, mergers, and name changes require historical symbol mapping. A split-adjusted price series needs to account for the old and new symbol relationships. Proper symbology management maintains this historical context so your backtests remain accurate.
Step 4: Timestamp Normalization
Every exchange operates on its own clock, often in different timezones. NYSE operates on Eastern Time. European exchanges use Central European Time. Asian markets follow their local timezones. Normalization converts all timestamps to a common reference, typically UTC with nanosecond precision.
Daylight saving time transitions create special challenges. When clocks jump forward or backward, sequence numbers become critical for maintaining correct ordering. The normalization layer must handle these edge cases to prevent data corruption during time transitions.
Step 5: Unit Standardization
Exchanges report prices and quantities in different units. One venue might quote prices in dollars (150.25), another in cents (15025), and a third in tenths of cents (150250). Normalization converts all prices to a standard unit, typically decimal dollars, to enable consistent comparison and calculation.
Volume units vary as well. Some exchanges report share quantities, others use lots or board lots. Currency pairs have their own conventions for position sizing. Unit standardization eliminates the mental math and conversion errors that plague multi-exchange analysis.
Step 6: Schema Conversion and Output
The final step converts the transformed data into your target schema. This might be a binary format for low-latency trading, JSON for web APIs, or Parquet for data lake storage. The output schema remains consistent regardless of which exchange provided the source data.
Most normalization systems support multiple output formats simultaneously. Real-time trading engines receive binary encoded messages. Historical databases ingest columnar formats. Research teams access JSON or CSV exports. All these outputs represent the same normalized data in different physical formats.
Key Normalization Processes
Successful normalization requires several specialized processes working together. Each addresses a specific type of heterogeneity found in exchange data. Understanding these processes helps you evaluate normalization solutions and identify gaps in your data pipeline.
Symbol Mapping and Symbology Standardization
Symbology represents one of the most complex normalization challenges. Exchanges use multiple identifier systems that rarely align. A single stock might have a ticker symbol on NYSE, a SEDOL in London, an ISIN globally, and a FIGI for open identification. Normalization maps these various identifiers to a canonical representation.
RICs (Reuters Instrument Codes) remain popular for cross-venue identification. Bloomberg tickers serve similar purposes. FIGI (Financial Instrument Global Identifier) offers an open standard gaining industry traction. ISIN provides regulatory compliance context. Your normalization system should support multiple identifier types and maintain mapping tables that update as instruments change.
Options and futures add complexity with expiration dates and strike prices. A single underlying symbol might have hundreds of derivative instruments. Each exchange represents these differently in their symbology. Normalization must parse these components and represent them consistently in the output schema.
Timestamp Normalization
Accurate timestamp handling separates professional-grade normalization from amateur implementations. Modern exchanges provide microsecond or nanosecond precision timestamps, but timezones and clock synchronization create subtle issues. Normalization must establish a single source of truth for event sequencing.
UTC serves as the standard reference for most systems. Conversion from local exchange time requires timezone database maintenance. Historical data needs correct handling of timezone changes and daylight saving transitions. Sequence numbers from exchanges provide additional ordering guarantees when timestamps alone are ambiguous.
Cross-exchange event correlation depends on synchronized timestamps. If you are analyzing arbitrage opportunities between NYSE and LSE, you need precise temporal alignment to calculate true latency and price discrepancies. Poor timestamp normalization creates false signals that erode trading profits.
Unit Standardization
Financial units vary dramatically across exchanges and asset classes. Equities typically trade in dollars or cents, but the representation differs. Forex pairs quote in pips or fractional pips with varying decimal places. Cryptocurrency exchanges use different precision levels for Bitcoin and altcoins.
Price normalization converts all values to a standard unit, typically decimal dollars for equities. This eliminates the risk of miscalculations when combining data from multiple sources. A price of “15025” from one exchange and “150.25” from another should normalize to the same value.
Volume standardization addresses lot sizes and minimum increments. Some markets trade in shares, others in round lots of 100. Options contracts represent 100 underlying shares. Normalization should clearly distinguish between contract quantity and underlying share equivalent to prevent position sizing errors.
Field Mapping and Schema Conversion
Each exchange defines its own message structures with different field names, orderings, and data types. One exchange might call it “last_price,” another “trade_price,” and a third “px_last.” Normalization maps these semantically equivalent fields to a consistent naming convention.
Data type conversion handles integer prices versus floating point, string versus numeric symbols, and various timestamp encodings. Binary protocols often pack multiple fields into bitsets for efficiency. Normalization expands these into explicit fields that are easier to work with in application code.
Field deduplication removes redundant data that some exchanges include for backward compatibility. Historical formats sometimes carry deprecated fields that newer venues have eliminated. Normalization focuses on the essential information while optionally preserving deprecated fields for specialized use cases.
Raw vs Normalized Market Data: Key Differences
Understanding when to use raw versus normalized data helps you make better architectural decisions. Both have valid use cases depending on your latency requirements, data analysis needs, and regulatory constraints. Here is how they compare across key attributes.
Structure and Format
Raw data preserves the exchange’s native format exactly as transmitted. This includes proprietary binary encodings, specific field layouts, and venue-specific message types. You see exactly what the exchange sent, which is essential for certain regulatory and debugging scenarios.
Normalized data restructures everything into a consistent schema. Field names, data types, and message structures become uniform across all sources. This consistency dramatically simplifies application development since you write code once that works with any exchange.
Latency and Performance
Raw data offers the lowest possible latency since no transformation occurs between the exchange and your application. Ultra-low latency trading strategies sometimes require direct exchange connectivity with zero intermediate processing. The tradeoff is dealing with heterogeneous formats in your trading logic.
Normalization adds processing overhead that increases latency. The transformation pipeline takes time, even when optimized. However, modern normalization systems achieve microsecond-level latency that satisfies most algorithmic trading requirements. For strategies holding positions longer than a few seconds, normalized data latency is negligible.
Storage and Retrieval
Raw data stores more compactly because it avoids the overhead of self-describing formats. Binary exchange protocols are designed for bandwidth efficiency. However, querying raw data requires exchange-specific parsing code that complicates historical analysis.
Normalized data typically requires more storage space due to standardized field naming and consistent schema structure. The benefit comes in query flexibility. You can run analysis across multiple exchanges using simple SQL or dataframe operations without worrying about format differences.
Use Case Comparison
| Attribute | Raw Data | Normalized Data |
|---|---|---|
| Latency | Lowest possible | Slightly higher (microseconds) |
| Format Consistency | Exchange-specific | Uniform across all sources |
| Development Complexity | High (custom parsers per exchange) | Low (single interface) |
| Storage Efficiency | More compact | Less compact |
| Query Flexibility | Limited | High |
| Debugging Capability | Excellent (see exactly what exchange sent) | Good (with provenance tracking) |
| Best For | HFT, regulatory compliance, debugging | Research, algorithmic trading, analytics |
Most sophisticated trading operations use both. Raw data feeds into normalization pipelines for real-time trading. Raw PCAP files archive for regulatory and debugging purposes. Normalized data serves research, backtesting, and strategy development. This dual approach gives you the benefits of each format where they matter most.
Multi-Exchange Challenges and Solutions
Combining data from multiple exchanges introduces challenges beyond simple format conversion. Each venue operates independently with different market structures, trading hours, and data policies. Normalization must account for these systemic differences to produce truly comparable data.
Market Structure Differences
Exchanges use different market models that affect how data should be interpreted. NYSE operates a hybrid auction and continuous trading model. NASDAQ uses a dealer-based structure. European exchanges have their own variations. Normalization must preserve market structure context so applications understand the trading environment behind the data.
Order book depth varies significantly. Some exchanges provide full depth-of-book data showing every price level. Others offer only top-of-book or limited depth snapshots. Normalization should clearly indicate the data type and not fabricate information where the exchange provided none.
Trading hours create discontinuities in consolidated feeds. When NYSE opens, Asian markets have closed. European markets overlap partially. Normalization should mark pre-market, regular, and after-hours sessions clearly so analytics account for liquidity differences across time periods.
Latency and Synchronization
Data arrives from different exchanges at different times due to network latency and exchange processing speeds. A trade on NYSE might report milliseconds before or after the corresponding price update from BATS even if they occurred simultaneously. Normalization cannot eliminate this physical reality but should timestamp accurately for later analysis.
Clock synchronization between exchanges is imperfect. Even with NTP and precision time protocols, microsecond-level discrepancies exist. Normalization systems should sequence data based on exchange-provided sequence numbers where available, using timestamps as secondary ordering keys.
For cross-exchange arbitrage strategies, understanding these latency patterns is essential. Normalization should preserve exchange identification and timing metadata so your trading logic can account for known latency differentials between venues.
Data Integrity and Error Handling
Exchanges occasionally issue corrections, cancels, and retractions. A trade reported at 10:00:00 might be busted at 10:00:05 due to error. Normalization must handle these updates correctly, either by updating the original record or by recording the cancellation as a separate event depending on your audit requirements.
Gap detection identifies missing sequence numbers that indicate dropped packets or feed interruptions. Quality normalization systems flag these gaps so you know when data might be incomplete. Feeds sometimes send replay messages to fill gaps, which normalization must handle without duplicating records in the output.
Checksums and integrity verification catch corrupted data. Network issues can flip bits in transit. Normalization should validate message checksums before processing and reject corrupted packets rather than propagating errors into your trading systems.
Bandwidth and Throughput Management
Major exchanges generate enormous data volumes during market stress. The NASDAQ totalview feed can exceed millions of messages per second during high volatility. Normalization infrastructure must handle these throughput spikes without dropping data or introducing unacceptable latency.
Network bandwidth planning is critical. Multiple raw feeds aggregated can saturate 10Gbps connections. Normalization systems often run on dedicated hardware with kernel bypass networking to achieve necessary throughput. Cloud-based normalization requires careful instance sizing and network configuration.
Selective filtering helps manage volume. Not every application needs every message type. Normalization systems can filter by symbol, message type, or price range to reduce downstream bandwidth. However, filtering should happen after parsing so you can apply sophisticated rules based on decoded content.
Benefits of Normalized Market Data
The investment in normalization infrastructure pays dividends across multiple dimensions. Organizations that normalize effectively gain competitive advantages in speed, accuracy, and operational efficiency. Here are the primary benefits driving adoption.
Algorithmic Trading Efficiency
Algorithmic trading strategies rely on consistent data inputs. A momentum strategy that works on NYSE data should work identically on NASDAQ data. Normalization enables this portability by ensuring data semantics remain constant across venues. You write the strategy once and deploy it anywhere.
Cross-exchange arbitrage specifically requires normalized data. Identifying price discrepancies between venues demands comparing like with like. If one feed reports prices in cents and another in dollars, your arbitrage calculations will be wrong. Normalization eliminates these unit conversion errors.
Backtesting accuracy improves with consistent historical data. Strategies tested on normalized data produce more reliable results because the input format matches live trading conditions. Raw data backtests often fail in production due to subtle format differences that normalization would have resolved.
Quantitative Research Productivity
Researchers spend less time on data wrangling and more on analysis with normalized feeds. Time allocated to parsing exchange-specific formats gets redirected to signal generation and model development. This productivity gain accelerates research cycles and improves outcomes.
Multi-exchange studies become feasible. Analyzing correlation patterns across global markets requires consistent data formats. Normalization makes these cross-market analyses straightforward, opening new research avenues that would be prohibitively complex with raw data.
Machine learning model performance benefits from consistent inputs. Models trained on heterogeneous data often learn format artifacts rather than true market signals. Normalized data ensures models focus on price action rather than encoding quirks of specific exchanges.
Risk Management and Compliance
Consolidated risk views require normalized data. Calculating portfolio exposure across positions held through different exchanges demands consistent price and position formats. Normalization enables real-time risk aggregation that would be impossible with raw venue-specific data.
Regulatory reporting often mandates specific data formats. Normalization transforms exchange data into regulatory-compliant structures automatically. This reduces compliance overhead and reporting errors that could trigger regulatory scrutiny.
T+1 settlement requirements increase data accuracy demands. Settlement failures cost money and damage relationships. Normalized data reduces settlement errors by ensuring trade details are consistently represented across all systems involved in the settlement process.
Operational Cost Reduction
Development costs drop when teams work with consistent data formats. New application development requires no exchange-specific parsing code. Maintenance burden decreases because format changes from one exchange do not require application updates if normalization handles the differences.
Infrastructure costs optimize through consolidation. A single normalization pipeline feeding multiple applications is more efficient than each application connecting directly to raw feeds. Bandwidth, compute, and operational monitoring all benefit from this consolidation.
Vendor flexibility increases with normalized data. Switching between data providers or adding new exchanges requires only normalization layer changes rather than application rewrites. This agility supports business expansion and vendor negotiations.
Technical Implementation Considerations
Building or buying a normalization solution requires careful technical planning. Performance characteristics, reliability requirements, and integration constraints drive architecture decisions. Here are the key technical factors to evaluate.
Latency Requirements
Determine your latency budget before selecting a normalization approach. High-frequency trading strategies holding positions for microseconds need direct exchange feeds with minimal processing. Strategies with longer holding periods can tolerate the additional microseconds that normalization adds.
Measure end-to-end latency through your normalization pipeline. Include network ingestion, protocol parsing, transformation, and output serialization. Profile each stage to identify bottlenecks. Modern FPGA-based normalization can achieve sub-microsecond latency for time-critical applications.
Consider parallelization strategies. Multiple normalization processes can handle different symbol ranges or message types independently. This horizontal scaling maintains latency under high throughput conditions that would overwhelm single-threaded implementations.
Throughput and Scalability
Size your infrastructure for peak market conditions, not averages. The 99.9th percentile message rate during market stress can be 10x higher than typical volumes. Normalization systems must handle these spikes without data loss or excessive latency degradation.
Memory management is critical in high-throughput scenarios. Garbage collection pauses in managed languages can cause millisecond-level latency spikes. Many high-performance normalization systems use C++ or Rust with explicit memory management to avoid these issues.
Network interface capacity limits throughput. 10Gbps interfaces can saturate with multiple full-depth market data feeds. 25Gbps or 100Gbps interfaces may be necessary for consolidated feeds covering many exchanges. Kernel bypass networking (DPDK, RDMA) reduces CPU overhead at these speeds.
Data Verification and Debugging
Packet capture provides the ultimate audit trail. PCAP files record exactly what arrived on the wire, enabling replay and verification. When normalized output looks suspicious, you can replay the PCAP through your normalization logic to determine whether the issue is in the source data or your transformation.
Provenance tracking links normalized records to their source. Each output message should carry metadata identifying the source exchange, input message identifiers, and processing timestamp. This lineage enables debugging and satisfies audit requirements for regulated activities.
Checksum validation catches corruption early. Both network-level checksums and application-level message checksums should be verified. Failures indicate network issues or exchange errors that require investigation. Rejecting corrupted messages prevents bad data from reaching trading systems.
Common Error Patterns
Symbol mapping errors cause the most visible normalization problems. An incorrect mapping sends data for the wrong instrument through your pipeline. This produces apparent arbitrage opportunities that are actually data errors. Rigorous symbol mapping table maintenance prevents these issues.
Unit conversion mistakes create subtle calculation errors. Confusing cents with dollars or contracts with shares produces wrong P&L calculations. These errors often go unnoticed until significant losses accumulate. Unit validation rules in your normalization layer catch these problems before they propagate.
Timezone handling errors spike during daylight saving transitions. Clock changes cause message ordering issues and timestamp ambiguity. Robust normalization systems use sequence numbers as the primary ordering key during these periods, falling back to timestamps only when sequence numbers are unavailable.
Frequently Asked Questions
How to normalize multiple data sets?
To normalize multiple data sets, follow these steps: First, ingest raw data from each source using appropriate protocol parsers. Second, map symbols from each exchange’s native format to a canonical identifier like ISIN or FIGI. Third, convert timestamps to a common timezone reference such as UTC. Fourth, standardize units so prices and volumes use consistent scales. Fifth, apply schema mapping to transform field names and structures to your target format. Finally, validate output integrity through checksums and provenance tracking.
How to normalize stock price data?
Stock price data normalization involves several techniques. Percentage change normalization converts absolute prices to relative returns, making cross-stock comparison easier. Moving average normalization smooths price series by dividing by a rolling average. Split-adjusted normalization accounts for stock splits and dividends to maintain historical continuity. Z-score normalization standardizes prices based on mean and standard deviation for statistical analysis. Min-max scaling transforms prices to a 0-1 range for machine learning applications.
What are the 5 levels of data normalization?
The 5 levels refer to database normalization principles rather than market data normalization. First Normal Form (1NF) eliminates repeating groups. Second Normal Form (2NF) removes partial dependencies. Third Normal Form (3NF) removes transitive dependencies. Boyce-Codd Normal Form (BCNF) addresses anomalies not covered by 3NF. Fourth and Fifth Normal Forms handle multi-valued dependencies and join dependencies. These database principles differ from market data normalization, which focuses on format standardization rather than relational structure.
How complex are trading algorithms?
Trading algorithm complexity varies dramatically based on strategy type and holding period. Simple algorithms might execute basic VWAP or TWAP strategies with minimal logic. Moderate complexity algorithms include momentum, mean reversion, and statistical arbitrage requiring real-time calculations and risk checks. High-complexity algorithms use machine learning models, natural language processing for sentiment analysis, and multi-factor optimization. HFT algorithms demand microsecond-level optimization with hardware acceleration. The complexity you need depends on your alpha generation requirements and infrastructure capabilities.
What is the difference between raw and normalized market data?
Raw market data preserves the exchange’s native format exactly as transmitted, including proprietary binary encodings and venue-specific message structures. It offers lowest latency but requires custom parsers for each exchange. Normalized market data converts all sources into a single standardized format with consistent field names, data types, and schemas. It adds slight latency but dramatically reduces development complexity. Raw data is preferred for HFT and debugging; normalized data excels for research, algorithmic trading, and multi-exchange analysis.
Why is market data normalization important?
Market data normalization is essential because it eliminates format fragmentation across exchanges, reduces operational complexity, and enables accurate cross-market analysis. Without normalization, every application must handle exchange-specific formats, multiplying development and maintenance costs. Normalized data ensures consistent inputs for algorithmic trading strategies, improves backtesting accuracy, supports reliable risk aggregation across venues, and simplifies regulatory compliance. It creates a foundation for machine learning models and quantitative research by removing data format artifacts that could confuse statistical analysis.
Conclusion
Market data normalization transforms the chaos of heterogeneous exchange feeds into consistent, usable information. By converting various source formats into a standardized structure, you unlock the ability to build sophisticated trading systems, conduct meaningful research, and manage risk across global markets. The process involves symbol mapping, timestamp alignment, unit standardization, and schema conversion working together seamlessly.
Whether you choose to build your own normalization infrastructure or purchase from a data vendor, understanding how the process works helps you make better decisions. Evaluate your latency requirements, throughput needs, and use cases carefully. Start with a clear definition of your target schema and work backward to source-specific mappings. Test thoroughly using PCAP replay and provenance tracking to ensure data integrity.
The investment in proper normalization pays dividends across your entire trading operation. Reduced development time, improved backtest accuracy, and simplified maintenance all contribute to a more agile and profitable business. As markets become increasingly interconnected and data volumes grow, the ability to normalize effectively will separate successful trading operations from those struggling with data fragmentation.