The first time I pulled up an options chain on my broker’s platform, I felt like I was staring at an alien dashboard. Rows of numbers in green and red, cryptic columns labeled “Delta” and “Theta,” and strike prices stretching in every direction. If that sounds familiar, you’re not alone. Learning how to read an options chain is the single biggest hurdle most beginners face before they can place their first trade.
By the end of this guide, you will know exactly what every column means, how to spot liquid contracts worth trading, and how to interpret the data to make informed decisions. I will walk you through a real example using Apple stock, explain the color coding you see on your screen, and share the mistakes I made so you can avoid them.
Table of Contents
What Is an Options Chain?
An options chain is a list of all available option contracts for a specific stock or ETF. Think of it like a restaurant menu showing every possible combination of expiration dates and strike prices you can order. Each line on the chain represents one contract that gives you the right to buy (call) or sell (put) the underlying stock at a specific price before a specific date.
The term “chain” comes from how the data is linked together. All the contracts for a particular stock are connected by the same underlying asset, but each one has unique terms. When you pull up an options chain for a stock like Tesla or SPY, you are seeing the complete universe of tradable contracts available at that moment.
You can find options chains on every major broker platform including Fidelity, Schwab, TD Ameritrade’s ThinkOrSwim, Robinhood, and Webull. Most platforms organize the data in a similar format once you know what to look for.
Understanding the Options Chain Layout
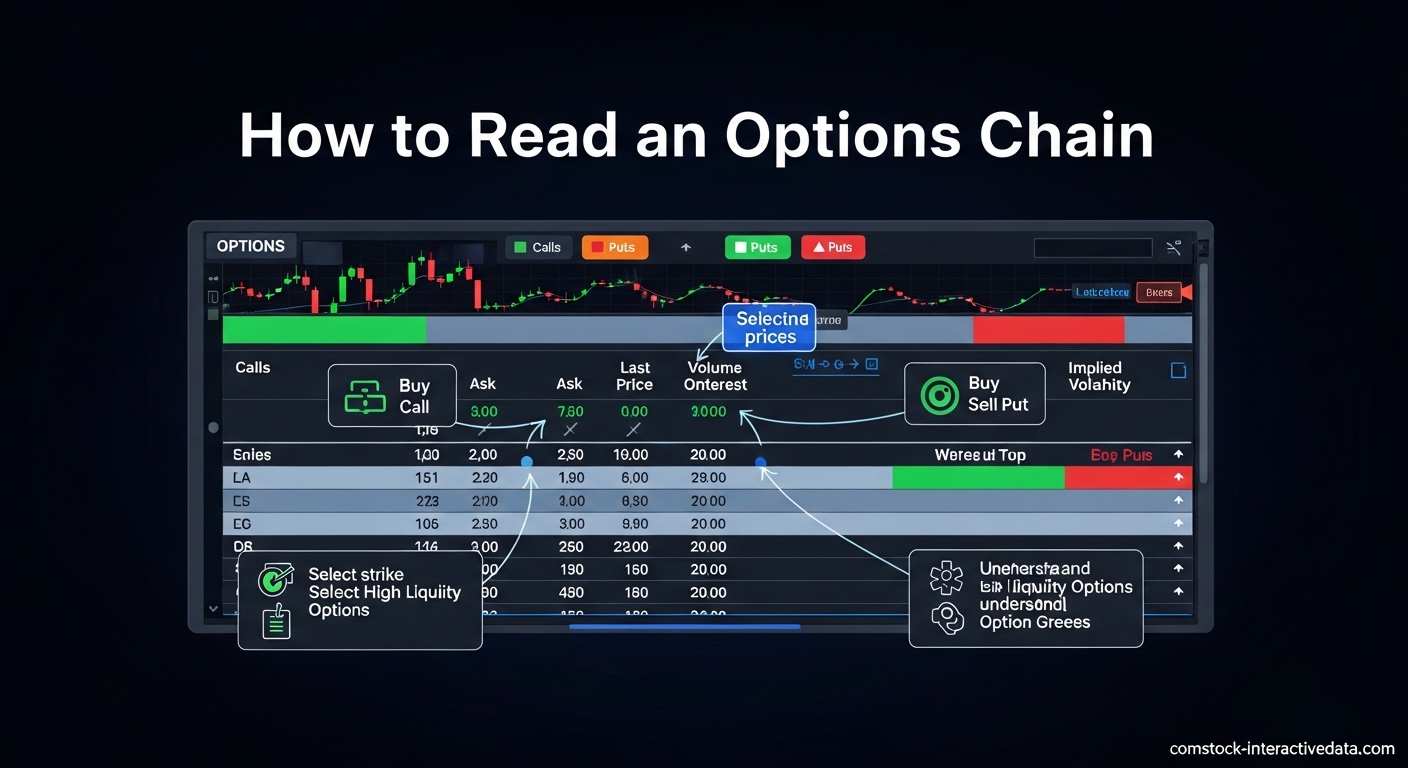
Most brokers display options chains in a “straddle” or side-by-side layout. The strike prices run down the center column like a spine. On the left side of the strikes, you will see all the call options. On the right side, you will see all the put options. This layout lets you compare calls and puts at the same strike price instantly.
At the top of the chain, you will find a dropdown or selector for expiration dates. Options expire weekly, monthly, or quarterly depending on the stock. When you select a different expiration date, the entire chain updates to show only contracts expiring on that date. This filtering is essential because option prices change dramatically based on how much time remains.
Most platforms use color coding to help you quickly identify important price levels. Green typically indicates in-the-money (ITM) options, while red indicates out-of-the-money (OTM) options. Some brokers use additional colors or bold text for the at-the-money (ATM) strike closest to the current stock price. These visual cues save you from calculating moneyness manually.
The 10 Core Components Every Beginner Must Know
Every options chain contains the same fundamental data points regardless of which broker you use. Understanding these ten components will give you the foundation to read any chain confidently.
1. Underlying Asset
This is the stock or ETF that the option contract is based on. Each contract controls 100 shares of this underlying asset. When you buy a call option on Apple (AAPL), you are acquiring the right to purchase 100 shares of Apple stock.
2. Expiration Date
The expiration date is the deadline when the option contract ceases to exist. After this date, the option is worthless if not exercised. Most stocks offer weekly expirations on Fridays, monthly expirations on the third Friday, and LEAPS (long-term options) expiring one to three years out.
Shorter expirations move faster and cost less. Longer expirations give you more time but cost more premium. This trade-off between time and cost is fundamental to options pricing.
3. Strike Price
The strike price is the predetermined price at which you can buy (call) or sell (put) the underlying stock. If you buy an AAPL $175 call, you have the right to purchase Apple shares at $175 per share regardless of where the market price actually trades. Strike prices typically increment by $1, $2.50, $5, or $10 depending on the stock price.
4. Call Options
Calls are listed on the left side of the chain. A call option gives you the right to buy the underlying stock at the strike price. Traders buy calls when they expect the stock price to rise. The higher the stock goes above your strike, the more valuable your call becomes.
5. Put Options
Puts are listed on the right side of the chain. A put option gives you the right to sell the underlying stock at the strike price. Traders buy puts when they expect the stock price to fall or want protection against a drop. The lower the stock goes below your strike, the more valuable your put becomes.
6. Bid and Ask Prices
The bid price is what buyers are willing to pay for the option right now. The ask price is what sellers are demanding to sell it. The difference between these two prices is called the bid-ask spread. A tight spread (a few cents) indicates high liquidity. A wide spread (dimes or dollars) suggests low liquidity and makes it harder to get fair pricing when you enter or exit.
7. Last Price
The last price shows the most recent trade that actually executed between a buyer and seller. While this gives you a reference point, it can be misleading if the last trade happened hours ago. For actively traded options on popular stocks, the last price updates continuously. For illiquid options, the last price might reflect a trade from yesterday.
8. Volume
Volume measures how many contracts have traded today. High volume (hundreds or thousands of contracts) indicates active interest and usually means tighter bid-ask spreads. Low volume (single digits or zero) warns you that finding a buyer when you want to sell could be difficult. I always check volume before entering any position.
9. Open Interest
Open interest shows the total number of outstanding contracts that exist for that strike and expiration. Unlike volume which resets daily, open interest accumulates over time. High open interest (thousands of contracts) indicates established liquidity. Combined with high volume, this is the ideal scenario for entering and exiting positions efficiently.
10. Implied Volatility (IV)
Implied volatility represents the market’s expectation of how much the stock price will move in the future. Expressed as a percentage, higher IV means the market expects bigger price swings and options cost more. Lower IV means calmer expectations and cheaper options. IV typically spikes before earnings announcements or major events, then drops afterward in a phenomenon called “IV crush.”
Understanding ‘Moneyness’: ITM, ATM, and OTM
Moneyness describes the relationship between the strike price and the current stock price. This concept determines whether exercising an option would be profitable right now and explains why some options cost significantly more than others.
In-the-Money (ITM) means exercising the option would give you an immediate benefit. For calls, this happens when the stock price is above the strike. For puts, it is when the stock price is below the strike. ITM options contain intrinsic value and cost more because they are already valuable.
At-the-Money (ATM) means the strike price is approximately equal to the current stock price. These options have no intrinsic value but contain maximum extrinsic value (time premium). ATM options are popular with traders because they offer the best balance of leverage and liquidity.
Out-of-the-Money (OTM) means exercising the option would be unprofitable right now. For calls, the stock price is below the strike. For puts, the stock price is above the strike. OTM options are cheaper and speculative. They only become profitable if the stock moves significantly in your favor before expiration.
| Moneyness | Call Options | Put Options | Intrinsic Value |
|---|---|---|---|
| In-the-Money (ITM) | Stock Price > Strike | Stock Price < Strike | Yes |
| At-the-Money (ATM) | Stock Price ≈ Strike | Stock Price ≈ Strike | No |
| Out-of-the-Money (OTM) | Stock Price < Strike | Stock Price > Strike | No |
Step-by-Step: How to Read an Options Chain
Now that you know the components, here is the exact process I use every time I analyze an options chain. Following these steps in order prevents the overwhelm that comes from staring at thousands of data points at once.
Step 1: Select Your Underlying Asset
Start by entering the ticker symbol for the stock or ETF you want to trade. I recommend beginners stick with highly liquid names like Apple (AAPL), Microsoft (MSFT), SPY, or QQQ. These stocks have tight bid-ask spreads and active volume, which means you will get fair pricing and can exit easily when needed.
Step 2: Choose Your Expiration Date
Select an expiration date that matches your trading timeline. If you expect a move within days, look at weekly options. If you need months for your thesis to play out, select monthly or quarterly expirations. Remember that options lose value faster as expiration approaches, so give yourself enough time but not so much that you overpay for time premium.
Step 3: Identify the Current Stock Price
Note the current market price of the underlying stock. This is your anchor point. Everything in the options chain is priced relative to this number. Write it down or keep it visible as you scan the strikes.
Step 4: Locate the At-the-Money (ATM) Strike
Find the strike price closest to the current stock price. This is your starting point for analysis. Most brokers highlight this row or display it in bold. The ATM strike typically has the highest open interest and volume, making it the most liquid option available.
Step 5: Analyze the Bid-Ask Spread
Check the difference between the bid and ask prices. For liquid options, this spread should be a few cents wide. If you see spreads of $0.10 or more, consider it a warning sign. Wide spreads mean you will lose money on both entry and exit due to poor pricing.
Step 6: Check Volume and Open Interest
Look for volume above 100 contracts and open interest above 1,000 contracts. These thresholds indicate sufficient liquidity. Avoid options with zero volume or minimal open interest unless you are comfortable holding until expiration.
Step 7: Review Implied Volatility
Compare the current IV to historical levels for that stock. If IV is unusually high, options are expensive and might drop in value after the event causing the spike passes. If IV is low, options are relatively cheap. Many platforms show IV rank or IV percentile to make this comparison easy.
Step 8: Select Call or Put Based on Your Outlook
Choose calls if you expect the stock to rise. Choose puts if you expect it to fall. Select a strike based on your risk tolerance. ITM options cost more but move more like the stock. OTM options are cheaper but require larger price moves to profit. ATM options offer balanced exposure.
Real Example: Reading AAPL’s Options Chain
Let me walk you through a concrete example using Apple (AAPL). Imagine it is July and AAPL is trading at $175.50. You expect Apple to rise over the next month and want to buy a call option.
You open the options chain and select the expiration date four weeks out. Scanning the strike prices, you find $175 is the ATM strike closest to the current price. The $175 call shows a bid of $3.20 and an ask of $3.40. This $0.20 spread is acceptable for a stock at this price level.
The volume column shows 2,500 contracts traded today with 15,000 open interest. These healthy numbers confirm liquidity will not be an issue. The implied volatility reads 28%, which is near average for AAPL, suggesting fair pricing without an earnings spike.
To purchase this call, you would pay the ask price of $3.40 per share, or $340 total for one contract controlling 100 shares. If AAPL rises to $185 by expiration, your call would be worth at least $10.00 ($185 minus $175 strike), giving you a profit of roughly $660 on your $340 investment.
However, if AAPL stays below $175, your option expires worthless and you lose the full $340. This risk-reward asymmetry is why position sizing matters so much. Never risk money you cannot afford to lose completely.
Introduction to the Greeks
Once you are comfortable reading the basic chain, you will notice columns labeled Delta, Gamma, Theta, and Vega. These are the Greeks, and they measure how sensitive an option’s price is to various factors. While optional for absolute beginners, understanding the basics will accelerate your trading education.
Delta measures how much the option price changes when the underlying stock moves $1. A delta of 0.50 means the option gains $0.50 for every $1 the stock rises. Delta also approximates the probability of the option expiring in-the-money.
Theta measures time decay. It shows how much value the option loses each day as expiration approaches. For buyers, theta is your enemy. For sellers, theta is your friend. ATM options typically have the highest theta.
Vega measures sensitivity to implied volatility changes. It shows how much the option price changes when IV moves 1%. High vega means your option gains value when volatility spikes and loses value when volatility drops.
Gamma measures how fast delta changes. High gamma means delta accelerates quickly as the stock moves, creating larger profits faster but also larger losses if the move goes against you.
Common Mistakes Beginners Make
After teaching dozens of friends how to read options chains, I have seen the same errors repeated. Here are the five most costly mistakes and how to avoid them.
Mistake 1: Ignoring Bid-Ask Spreads
Beginners often look only at the last price and assume that is what they will pay. The reality is you buy at the ask and sell at the bid. A wide spread means you start your trade with an immediate paper loss. Always check the spread before clicking buy.
Mistake 2: Buying Before Earnings
Options are expensive right before earnings because implied volatility is elevated. If you buy at these inflated prices and the stock does not move dramatically, you suffer IV crush. This is where option values collapse after the event passes even if the stock moves in your direction.
Mistake 3: Trading Illiquid Options
Low volume and open interest make it difficult to exit positions. You might be forced to accept a terrible price to close your trade or hold until expiration against your will. Stick to strikes with at least 100 contracts of daily volume.
Mistake 4: Misunderstanding Time Decay
Options lose value every day. Theta accelerates in the final week before expiration. Many beginners buy short-term options thinking they are cheap, then watch helplessly as time decay eats their position even when the stock does not move against them.
Mistake 5: Oversizing Positions
Options offer leverage, which magnifies both gains and losses. A common rule is risking no more than 1-2% of your account on any single options trade. Violating this rule with oversized positions is how accounts blow up from one bad trade.
Pro Tips for Reading Options Chains
Here are six additional tips I wish someone had shared with me when I started trading options in 2026.
Tip 1: Start with Liquid Underlyings
SPY, QQQ, AAPL, TSLA, and MSFT offer the best liquidity for beginners. Their options chains show tight spreads and active volume, giving you fair pricing and easy exits.
Tip 2: Use Paper Trading First
Every major broker offers paper trading accounts. Practice reading chains and placing trades with fake money for at least a month. This builds confidence without risking real capital while you learn.
Tip 3: Focus on ATM Options Initially
At-the-money options provide the best balance of liquidity, price movement, and educational value. Master these before experimenting with deep ITM or far OTM contracts.
Tip 4: Check the VIX
The VIX measures overall market volatility. When the VIX is high, all options become more expensive. When the VIX is low, options are cheaper. Use this context to time your entries.
Tip 5: Set Price Alerts
Configure alerts for key strike prices so you know when stocks approach levels where you want to trade. This prevents constantly staring at screens and helps you catch opportunities.
Tip 6: Use Mobile Apps Wisely
Broker mobile apps are great for monitoring positions but often lack the full options chain detail of desktop platforms. Use desktop for analysis and mobile for quick checks.
FAQs
What is the best platform for viewing options chains?
ThinkOrSwim by TD Ameritrade consistently ranks as the most comprehensive platform for options analysis. It offers advanced features like probability analysis and customizable Greeks columns. For simplicity, Robinhood and Webull provide clean mobile-friendly interfaces. Fidelity Active Trader Pro and Schwab StreetSmart Edge offer excellent desktop experiences with robust chain visualization.
How do I know if an option has good liquidity?
Check three metrics: daily volume above 100 contracts, open interest above 1,000 contracts, and bid-ask spreads under $0.10 for most stocks. High liquidity means you can enter and exit positions at fair prices without slippage. Avoid options showing zero volume or wide spreads exceeding $0.50.
What is a good bid-ask spread?
For options under $1.00, spreads of $0.01 to $0.03 are excellent. For options between $1.00 and $5.00, spreads under $0.10 are acceptable. For expensive options over $5.00, spreads under $0.20 are reasonable. Anything wider indicates poor liquidity and makes profitable trading difficult.
Should I focus on calls or puts as a beginner?
Most beginners find calls more intuitive because buying a call is similar to buying stock (you profit when prices rise). However, learning puts is essential for a complete education. Start with paper trading both to understand how each behaves. Your market outlook should determine which you use, not your comfort level.
How far out should I set my expiration date?
Beginners should target expirations between 30 and 60 days out. This timeframe balances affordable premiums with enough time for your thesis to develop. Avoid weekly options (high time decay risk) and LEAPS (expensive, slower price movement) until you gain experience. Always give yourself more time than you think you need.
Conclusion
You now have everything you need to read an options chain with confidence. From understanding the layout to analyzing bid-ask spreads, checking volume, and interpreting implied volatility, you possess the foundational skills that separate informed traders from gamblers.
The key is starting small. Open a paper trading account today and practice reading chains for stocks you follow. Place a few fake trades and watch how the values change as the underlying stock moves and time passes. This hands-on experience will cement your knowledge better than any article.
Once you are consistently profitable in paper trading, consider trading with real money using only 1-2% of your account per trade. Keep a journal of your options chain analysis before each trade to build discipline. Options trading rewards preparation and punishes impulsive decisions.
The options chain is your roadmap to the derivatives market. Master reading it, and you have overcome the biggest obstacle most beginners face. The rest is strategy, risk management, and continuous learning.