
Candlestick Patterns Explained (August 2026) A Beginner’s Guide
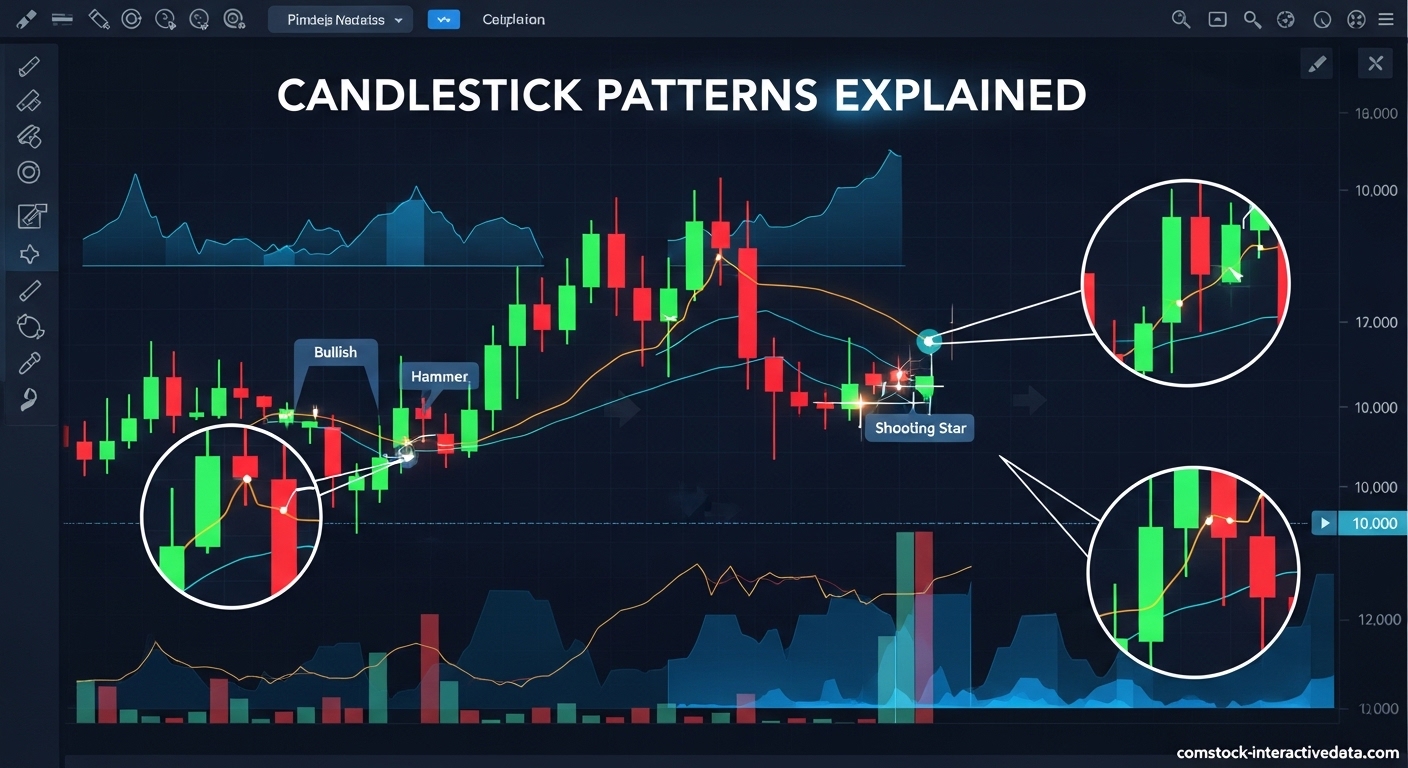
Candlestick patterns are visual representations of price movement that reveal the battle between buyers and sellers in financial markets. Each candlestick captures four essential price points: open, high, low, and close. These patterns have helped traders predict market direction for over 300 years. Our team has spent over 15 years analyzing charts across stocks, forex, … Read more