Candlestick patterns are visual representations of price movement that reveal the battle between buyers and sellers in financial markets. Each candlestick captures four essential price points: open, high, low, and close. These patterns have helped traders predict market direction for over 300 years.
Our team has spent over 15 years analyzing charts across stocks, forex, and cryptocurrency markets. We’ve learned that candlestick patterns aren’t magic indicators. They’re tools that show market psychology in action.
Table of Contents
Key Takeaways
- Candlestick charts originated in 18th-century Japan for rice trading and display open, high, low, and close prices in a visual format
- Each candlestick consists of a real body (open-to-close range) and shadows/wicks (high-to-low range)
- Green or hollow candlesticks indicate bullish price movement; red or filled candlesticks indicate bearish movement
- Single patterns like Doji and Hammer signal indecision or potential reversals with one candle
- Multi-candle patterns like Engulfing and Morning/Evening Stars provide stronger reversal signals
- No pattern works 100% of the time; always wait for confirmation and consider market context
- Beginners should start with 5-10 core patterns rather than trying to memorize all 75+ variations
What Are Candlestick Charts?
Candlestick charts are a visual method of displaying price data that reveals market sentiment and potential trend direction. Each candlestick represents a specific time period and shows four critical price points: the opening price, highest price, lowest price, and closing price.
Unlike simple line charts that only show closing prices, candlesticks reveal the full story of price action. They show where buyers and sellers fought, who won each battle, and how much ground they gained or lost.
The real power of candlestick patterns lies in their ability to visualize market psychology. Long bodies show strong conviction. Short bodies show indecision. Long shadows reject price levels. When these elements combine into recognizable patterns, they hint at what might happen next.
History and Origin of Candlestick Charts
Candlestick charting traces back to 18th-century Japan and the rice trading markets of Osaka. A Japanese rice trader named Munehisa Homma developed this technique to track price movements and market psychology.
Homma dominated the rice trading scene during the 1700s, amassing a fortune by understanding how emotion drove prices. He observed that markets were influenced by the fear and greed of participants. His insights laid the foundation for what we now call technical analysis and market psychology.
The trading principles from Homma’s era spread through Japanese trading circles for centuries. The method remained largely unknown in the West until Steve Nison introduced it through his 2026 publications. Nison’s work brought Japanese candlestick charting techniques to Western traders and investors.
Today, candlestick charts have become the standard for technical analysis across all markets. From stock exchanges to cryptocurrency platforms, traders rely on these visual tools to make informed decisions. The principles Homma discovered centuries ago remain relevant in modern digital markets.
Understanding Candlestick Components
Every candlestick consists of three main parts: the real body, the upper shadow, and the lower shadow. Understanding these components is essential before learning to recognize patterns.
The Real Body
The real body is the rectangular portion of the candlestick connecting the opening and closing prices. It represents the price range between where the period started and where it ended.
A long real body indicates strong buying or selling pressure. When buyers control the session, the body extends upward and typically appears green or hollow. When sellers dominate, the body extends downward and appears red or filled.
Short real bodies suggest indecision in the market. Neither buyers nor sellers gained significant ground. These small bodies often appear at turning points or during consolidation periods.
Shadows (Wicks and Tails)
Shadows, also called wicks or tails, are the thin lines extending above and below the real body. They show the highest and lowest prices reached during the trading period.
The upper shadow extends from the top of the real body to the high of the period. It represents prices that were rejected by sellers pushing back down. Long upper shadows suggest selling pressure above the closing level.
The lower shadow extends from the bottom of the real body to the low of the period. It shows prices that were rejected by buyers pushing back up. Long lower shadows indicate buying pressure below the closing level.
A candlestick with no shadows is called a Marubozu. This rare formation shows complete control by either buyers or sellers throughout the entire trading period.
Colors and Direction
Candlestick colors indicate whether the closing price was higher or lower than the opening price. Different platforms use different color schemes, which causes confusion for many beginners.
The most common modern scheme uses green for bullish candles and red for bearish candles. A green candle means the close was higher than the open. A red candle means the close was lower than the open.
Some traditional platforms use hollow and filled bodies instead. Hollow or white candles indicate bullish movement. Filled or black candles indicate bearish movement. Check your platform settings to confirm which scheme you’re viewing.
Understanding OHLC data (Open, High, Low, Close) is fundamental to reading candlesticks. These four points create the complete picture of price action for any given period.
How to Read Candlestick Charts?
Reading candlestick charts involves understanding what each formation tells you about market sentiment and the balance of power between bulls and bears. Follow these steps to interpret any candlestick you encounter.
Step 1: Check the Color – Determine if the candle is bullish (green/hollow) or bearish (red/filled). This tells you who won the battle between open and close.
Step 2: Analyze the Body Size – Long bodies show strong conviction and decisive control. Short bodies show indecision, weakness, or a balance between buyers and sellers.
Step 3: Examine the Shadows – Long upper shadows indicate rejection of higher prices. Long lower shadows indicate rejection of lower prices. No shadows show complete dominance.
Step 4: Consider the Context – Where does this candle appear? At support? At resistance? After a long trend? Context determines whether a pattern is significant or meaningless.
Step 5: Look for Patterns – Single candles tell part of the story. Patterns of multiple candles provide stronger signals. Compare current candles to previous ones.
Step 6: Wait for Confirmation – Never trade based on a single candle or pattern alone. Wait for the next candle to confirm the signal before taking action.
When you see a long green candle with small shadows after a downtrend, buyers have seized control. When you see a long red candle with small shadows after an uptrend, sellers have taken over. These simple observations form the foundation of candlestick analysis.
Single Candlestick Patterns
Single candlestick patterns provide immediate signals about market sentiment and potential reversals. These patterns require only one candle to form, making them quick to identify.
Doji Patterns (Dragonfly, Gravestone, Long-Legged)
A Doji forms when the opening and closing prices are virtually equal, creating a cross or plus sign shape. This pattern represents complete indecision between buyers and sellers.
The standard Doji has upper and lower shadows of roughly equal length. It shows that prices moved both up and down during the period, but the market closed right where it started. This equilibrium suggests a potential reversal or continuation pause.
The Dragonfly Doji has a long lower shadow and little to no upper shadow. It forms when open, high, and close are at the same level. This pattern shows that sellers pushed prices down significantly, but buyers fought back to close at the open level. It often signals a bullish reversal when appearing at the bottom of a downtrend.
The Gravestone Doji has a long upper shadow and little to no lower shadow. It forms when open, low, and close are at the same level. This pattern shows that buyers pushed prices up, but sellers overwhelmed them to close at the open level. It often signals a bearish reversal when appearing at the top of an uptrend.
The Long-Legged Doji has long upper and lower shadows with a small real body in the middle. It shows extreme indecision with significant volatility during the period but no net change. This pattern frequently appears at major turning points.
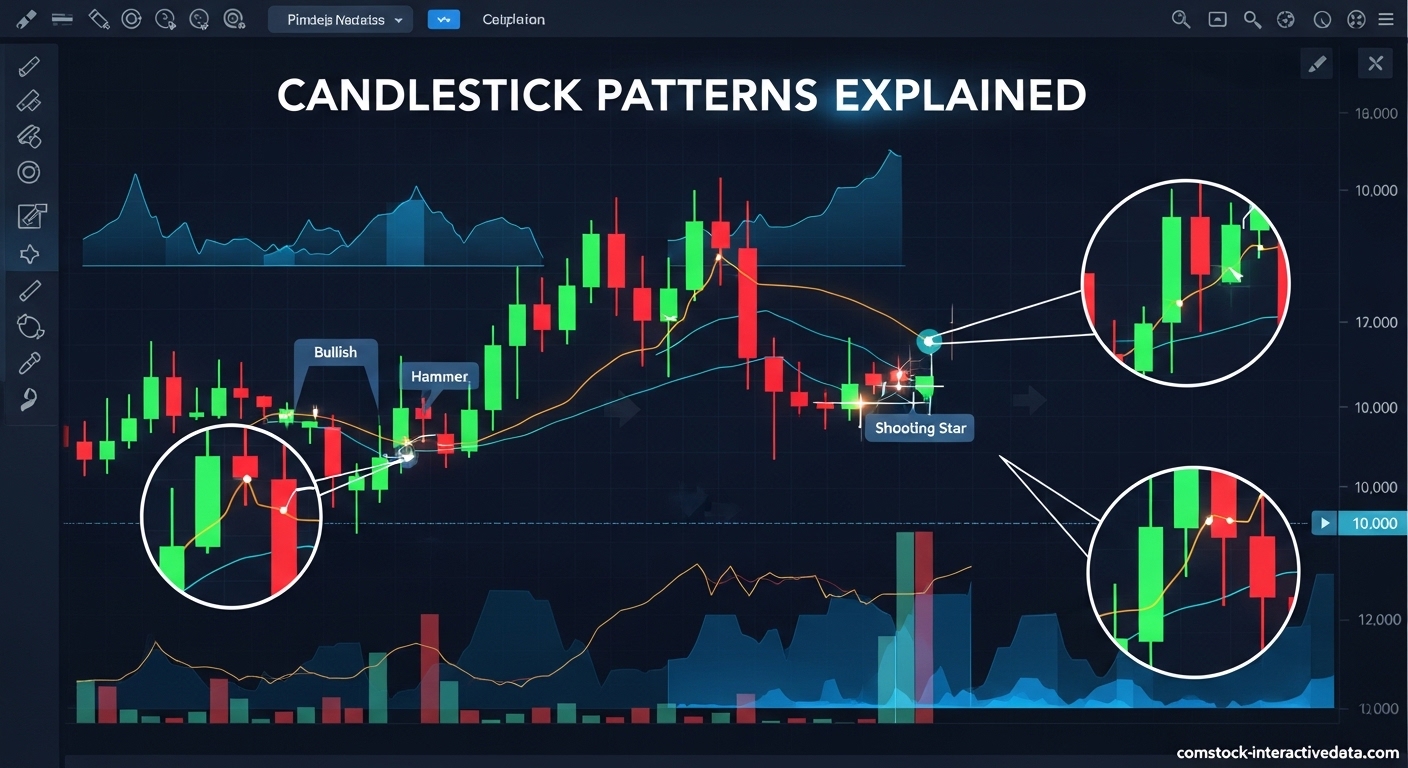
Hammer and Hanging Man
The Hammer and Hanging Man look identical but appear in different contexts and signal opposite outcomes. Both feature a small real body at the upper end of the trading range with a long lower shadow.
The Hammer appears during a downtrend. It has a small body at the top with a long lower shadow at least twice the length of the body. The color can be green or red, though green hammers are more bullish. This pattern shows that sellers drove prices down, but buyers regained control to close near the open. It signals a potential bullish reversal.
The Hanging Man appears during an uptrend. It has the same formation as the Hammer but signals potential bearish reversal. This pattern shows that sellers are starting to challenge buyer control. Even though buyers pushed back to close near highs, the long lower shadow reveals selling pressure.
Both patterns require confirmation. A Hammer needs a bullish candle the next day to confirm reversal. A Hanging Man needs a bearish candle to confirm the warning signal.
Marubozu Candles
A Marubozu is a candlestick with no shadows, indicating that the open and close were also the high and low of the period. This shows complete control by one side throughout the entire trading session.
A Bullish Marubozu (green or hollow) opens at the low and closes at the high. Buyers controlled the session from start to finish without any significant selling pressure. This strong bullish signal often indicates continued upward movement.
A Bearish Marubozu (red or filled) opens at the high and closes at the low. Sellers dominated the entire session without meaningful buyer resistance. This strong bearish signal often indicates continued downward movement.
Marubozu candles are rare but powerful. They show conviction and commitment from either buyers or sellers. When they appear at key support or resistance levels, they often signal decisive breaks.
Spinning Top
A Spinning Top features a small real body centered between long upper and lower shadows. Unlike Doji patterns, Spinning Tops have a visible body, though it remains small relative to the total range.
This pattern shows significant price movement both up and down during the period, but neither buyers nor sellers gained meaningful ground. The small body reveals that open and close were close together despite the volatility.
Spinning Tops signal indecision and potential trend change. After a strong uptrend, a Spinning Top suggests buyers are losing strength. After a strong downtrend, it suggests sellers are losing control. The next candle usually determines the new direction.
Bullish Reversal Patterns
Bullish reversal patterns signal that a downtrend may be ending and an uptrend may begin. These patterns appear after price declines and suggest buyer strength returning to the market.
Bullish Engulfing Pattern
The Bullish Engulfing pattern consists of two candles and signals a strong potential reversal from bearish to bullish. It forms after a downtrend and requires specific conditions.
The first candle is a smaller bearish (red) candle continuing the existing downtrend. The second candle is a larger bullish (green) candle that completely engulfs the body of the first candle. The second candle must open below the first candle’s close and close above the first candle’s open.
This pattern shows that buyers have completely overwhelmed sellers. The second day’s buying pressure was strong enough to not only reverse the previous day’s losses but exceed them. Volume should increase on the second day for strongest confirmation.
The Bullish Engulfing pattern works best after a sustained downtrend. When it appears near support levels, it becomes even more reliable. Always wait for the next candle to confirm before entering a position.
Morning Star Pattern
The Morning Star is a three-candle bullish reversal pattern that signals the end of a downtrend. Its name reflects the appearance of light (buyers) after darkness (sellers).
The first candle is a long bearish candle continuing the downtrend. The second candle is a small-bodied candle that gaps down from the first. This middle candle can be bullish, bearish, or a Doji. The small body shows that selling pressure is weakening.
The third candle is a long bullish candle that closes well into the body of the first candle. This shows that buyers have taken control and reversed the previous selling. The stronger the third candle, the more reliable the pattern.
The Morning Star pattern is one of the most reliable bullish reversal signals. The three-candle structure provides multiple confirmations of trend change. Traders often use this pattern to enter long positions with stops below the pattern’s low.
Bullish Harami
The Bullish Harami is a two-candle pattern signaling potential trend reversal. Harami means pregnant in Japanese, describing how the pattern looks like a mother candle containing a baby candle.
The first candle is a large bearish candle with a long real body. The second candle is a small bullish candle whose entire body fits within the vertical range of the first candle’s body. The second candle must not exceed the open or close of the first candle.
This pattern shows that selling momentum has stalled. The large first candle shows strong selling, but the small second candle shows buyers resisting and preventing further declines. The contained nature suggests indecision after a strong trend.
Bullish Harami patterns are moderate reliability signals. They work better when the first candle is exceptionally large and the second candle is exceptionally small. Look for confirmation on the third candle before trading.
Inverted Hammer
The Inverted Hammer looks like an upside-down Hammer and signals potential bullish reversal. It appears during downtrends and has a small body at the lower end with a long upper shadow.
The long upper shadow shows that buyers tried to push prices up significantly during the period. Even though sellers pushed prices back down to close near the open, the failed breakout attempt reveals buyer interest.
The Inverted Hammer requires strong confirmation because the close remains near the low. Look for a bullish candle the following day that closes above the Inverted Hammer’s close. This confirms that buyers have truly taken control.
Bearish Reversal Patterns
Bearish reversal patterns indicate that an uptrend may be ending and a downtrend may begin. These patterns appear after price advances and suggest seller strength returning.
Bearish Engulfing Pattern
The Bearish Engulfing pattern is the mirror image of the Bullish Engulfing pattern. It signals potential reversal from bullish to bearish trend after an uptrend.
The first candle is a smaller bullish (green) candle continuing the uptrend. The second candle is a larger bearish (red) candle that completely engulfs the body of the first candle. The second candle opens above the first close and closes below the first open.
This pattern shows that sellers have overwhelmed buyers completely. The strong selling pressure not only erased the previous day’s gains but pushed prices significantly lower. The larger the second candle, the stronger the reversal signal.
Bearish Engulfing patterns near resistance levels are particularly reliable. When combined with high volume on the second candle, they provide strong warnings to close long positions or enter short positions.
Evening Star Pattern
The Evening Star is the bearish counterpart to the Morning Star. This three-candle pattern signals that an uptrend may be ending and selling pressure is taking over.
The first candle is a long bullish candle continuing the uptrend. The second candle is a small-bodied candle that gaps up from the first. This middle candle shows weakening buying momentum. The gap up and small body reveal that buyers are struggling to maintain control.
The third candle is a long bearish candle that closes deep into the body of the first candle. This shows that sellers have seized control and reversed the previous buying. The deeper the third candle penetrates the first candle, the stronger the reversal.
The Evening Star is one of the most reliable bearish reversal patterns. Traders often use it to exit long positions or enter short positions. Place stops above the highest point of the pattern for risk management.
Bearish Harami
The Bearish Harami signals potential bearish reversal after an uptrend. It has the same mother-and-child appearance as the Bullish Harami but forms in the opposite context.
The first candle is a large bullish candle with a long real body continuing the uptrend. The second candle is a small bearish candle contained entirely within the first candle’s body range.
This pattern shows that buying momentum has stalled. The large first candle demonstrates strong buying, but the small second candle shows sellers preventing further advances. The contained second candle represents indecision.
Bearish Harami patterns require confirmation. Wait for a bearish candle following the pattern before taking action. The pattern becomes more reliable when the second candle is a Doji, creating a Harami Cross.
Shooting Star
The Shooting Star is a single-candle bearish reversal pattern that appears during uptrends. It looks like an inverted Hammer but signals opposite price direction.
This pattern has a small real body at the lower end of the trading range with a long upper shadow at least twice the body length. The color can be green or red, though red Shooting Stars are more bearish.
The long upper shadow shows that buyers pushed prices up significantly during the period. However, sellers overwhelmed them and pushed prices back down to close near the open. This rejection of higher prices signals weakening buyer control.
Shooting Stars require bearish confirmation the following day. The pattern near resistance levels provides stronger signals. Never short based solely on a Shooting Star without confirmation.
Continuation Patterns
Continuation patterns suggest that the current trend will resume after a brief pause. These patterns don’t signal reversals but rather indicate that buyers or sellers are resting before continuing.
The Rising Three Methods pattern forms during uptrends and signals bullish continuation. It starts with a long bullish candle, followed by three small bearish candles that stay within the range of the first candle, then ends with another long bullish candle that closes above the first candle’s close. This pattern shows that sellers tried to reverse the trend but failed.
The Falling Three Methods pattern forms during downtrends and signals bearish continuation. It starts with a long bearish candle, followed by three small bullish candles contained within the first candle’s range, then ends with another long bearish candle that closes below the first candle’s close. This pattern shows that buyers tried to reverse but failed.
Three Methods patterns are highly reliable continuation signals. They demonstrate that the dominant trend force remains in control despite counter-trend attempts. Traders often add to existing positions when these patterns complete.
Another continuation pattern is the Side-by-Side White Lines, where two consecutive bullish candles with similar opens and closes appear during an uptrend. This shows consistent buying pressure without seller interference.
Candlestick Patterns vs Other Chart Types
Understanding how candlestick charts compare to bar charts and line charts helps you choose the right visualization for your analysis style. Each chart type presents the same price data differently.
Line charts connect closing prices with a single continuous line. They show the simplest view of price direction over time but hide all information about opens, highs, and lows. Line charts work well for identifying overall trends but fail to show intraday volatility or market sentiment.
Bar charts display the same OHLC data as candlesticks but use horizontal lines instead of bodies. The left tick shows the open, the right tick shows the close, and the vertical line shows the high and low. Bar charts present identical information to candlesticks in a different visual format.
Candlestick charts offer several advantages over other types. The colored bodies provide instant recognition of bullish or bearish periods. The filled or hollow appearance creates visual contrast that’s easier to process quickly. Pattern recognition comes more naturally with candlesticks due to their distinct shapes.
| Feature | Candlestick | Bar Chart | Line Chart |
|---|---|---|---|
| Shows OHLC data | Yes | Yes | Close only |
| Visual sentiment | Excellent | Good | Poor |
| Pattern recognition | Excellent | Moderate | Impossible |
| Best for beginners | Yes | Intermediate | Basic trend only |
| Information density | High | High | Low |
Most professional traders prefer candlestick charts for active trading decisions. Line charts serve better for long-term trend analysis. Bar charts work well for traders who prefer minimalist visualization.
Common Beginner Mistakes to Avoid
After analyzing forum discussions from thousands of beginner traders, we’ve identified the most common and costly mistakes people make when learning candlestick patterns. Avoiding these pitfalls will accelerate your learning curve significantly.
Mistake 1: Trading Every Pattern You See – Beginners often treat every candlestick pattern as a trading signal. Not all patterns are meaningful. A Hammer in the middle of a range means nothing. Context determines significance.
Mistake 2: Ignoring Confirmation – The most expensive mistake is entering trades immediately when a pattern forms. Candlestick patterns are warnings, not guarantees. Always wait for the next candle to confirm before risking money.
Mistake 3: Using Patterns in Isolation – Candlestick patterns work best when combined with support and resistance levels, trend lines, and volume analysis. Using them alone is like driving with only one eye open.
Mistake 4: Confusing Hammer and Hanging Man – These identical-looking patterns have opposite meanings depending on trend context. The Hammer appears at bottoms and is bullish. The Hanging Man appears at tops and is bearish. Check the trend before interpreting.
Mistake 5: Color Confusion Across Platforms – Some platforms use green/red, others use hollow/filled, and some use white/black. A hollow candle on one platform might mean the opposite of a hollow candle on another. Verify your platform’s color scheme.
Mistake 6: Expecting 100% Accuracy – No candlestick pattern works every time. Even the most reliable patterns fail 30-40% of the time. Risk management matters more than pattern selection.
Mistake 7: Learning Too Many Patterns at Once – Beginners overwhelm themselves by trying to memorize 50+ patterns immediately. Start with 5-10 core patterns: Doji, Hammer, Engulfing, Morning Star, Evening Star. Master these before expanding.
Mistake 8: Trading Low Timeframes Too Early – Patterns on 1-minute and 5-minute charts are noisy and unreliable. Beginners should start with daily or 4-hour charts where patterns carry more significance.
Limitations and Best Practices
Candlestick patterns provide valuable insights but have significant limitations every trader must understand. Acknowledging these limitations separates successful traders from those who blame their tools.
Pattern reliability varies significantly depending on market conditions. Research by technical analysts suggests that even the best reversal patterns succeed only 60-70% of the time with proper confirmation. Without confirmation, accuracy drops below 50%.
Candlestick patterns reflect historical price action, not future guarantees. They show what happened, not what will happen. Markets change, and patterns that worked historically may fail in new conditions.
Modern algorithmic trading has changed pattern effectiveness. High-frequency trading creates noise that can generate false patterns. Patterns work better in markets with genuine human participation.
Best practices for using candlestick patterns effectively:
- Always combine patterns with support and resistance levels for higher accuracy
- Require volume confirmation on breakout patterns
- Use multiple timeframe analysis to confirm pattern significance
- Wait for the candle to close before analyzing it
- Apply patterns in trending markets rather than choppy, ranging markets
- Consider overall market conditions and news events
- Never risk more than 1-2% of your account on any pattern-based trade
- Keep a trading journal to track which patterns work best for your style
Candlestick patterns work best as part of a complete trading system. Combine them with proper risk management, position sizing, and psychological discipline for consistent results.
Frequently Asked Questions
What is a candlestick pattern?
A candlestick pattern is a visual representation of price movement during a specific time period, showing the open, high, low, and close prices. These patterns help traders identify market sentiment and potential trend reversals or continuations.
How do you read a candlestick chart for beginners?
Start by checking the candle color: green or hollow means the close was higher than the open (bullish), while red or filled means the close was lower (bearish). Examine the body size to see conviction level. Check the shadows to see price rejection levels. Finally, consider context by looking at where the candle appears in the overall trend.
What are the most important candlestick patterns?
The most important patterns for beginners to learn are: Bullish Engulfing, Bearish Engulfing, Morning Star, Evening Star, Doji, Hammer, and Shooting Star. These 7 patterns appear frequently and provide reliable signals when confirmed properly.
How many candlestick patterns are there?
There are over 75 recognized candlestick patterns ranging from single-candle formations to complex multi-candle setups. However, beginners should focus on mastering 5-10 core patterns rather than trying to memorize all variations.
What does a doji candlestick mean?
A Doji forms when the opening and closing prices are virtually equal, creating a cross shape. It represents market indecision where neither buyers nor sellers gained control. Depending on shadow length and position, Doji patterns can signal potential reversals or continuation pauses.
What is the difference between bullish and bearish candlestick patterns?
Bullish patterns typically appear after downtrends and signal potential upward price movement. They often feature green candles, long lower shadows, or strong buying candles that engulf previous selling. Bearish patterns appear after uptrends and signal potential downward movement, featuring red candles, long upper shadows, or strong selling pressure.
How accurate are candlestick patterns?
Even the most reliable candlestick patterns succeed only 60-70% of the time when properly confirmed with additional candles. Without confirmation, accuracy drops below 50%. Pattern reliability improves when combined with support and resistance levels, volume analysis, and trend context.
What is the best candlestick pattern for day trading?
For day trading, the Bullish Engulfing and Bearish Engulfing patterns work well because they provide clear entry signals with defined risk levels. The Morning Star and Evening Star patterns are also effective for identifying intraday reversals. Always use these on 15-minute or higher timeframes for best results.
Conclusion
Candlestick patterns remain one of the most valuable tools for understanding market psychology and identifying potential trading opportunities. These visual representations of price action have guided traders for over 300 years, from Japanese rice markets to modern cryptocurrency exchanges.
Learning candlestick patterns takes time and practice. Start with the core patterns: Doji, Hammer, Engulfing formations, and Morning/Evening Stars. Master reading single candles before tackling complex multi-candle patterns.
Remember that candlestick patterns are not magic predictors. They work best when combined with proper risk management, confirmation signals, and understanding of market context. No pattern works every time, and successful trading requires discipline beyond pattern recognition.
Practice identifying patterns on historical charts before risking real money. Most trading platforms offer demo accounts where you can build pattern recognition skills without financial risk. Spend at least 30 days paper trading before using candlestick patterns with real capital.
Candlestick patterns explained in this guide give you a foundation for technical analysis. Continue your education by studying support and resistance, volume analysis, and multi-timeframe confirmation. The journey to becoming a skilled chart reader starts with these basic building blocks.